 SNAP GeoNetwork
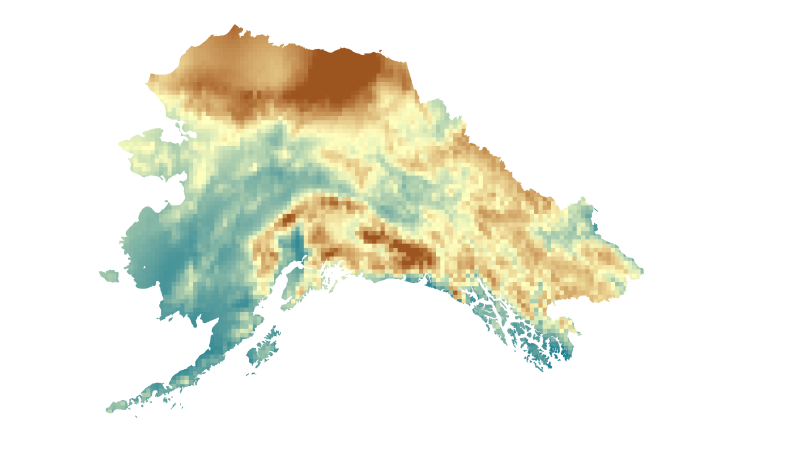
Projected Monthly Vapor Pressure AR5 RCP 8.5
This set of files includes downscaled future projections of vapor pressure (units=hPa) at a 1km spatial scale.
This data has been prepared as model input for the Integrated Ecosystem Model (IEM). There can be errors or serious limitations to the application of this data to other analyses. The data constitute the result of a downscaling procedure using 2 General Circulation Models (GCM) from the Coupled Model Intercomparison Project 5 (CMIP5) for RCP 8.5 scenario (2006-2100) monthly time series and Climatic Research Unit (CRU) TS2.0 (1961-1990,10 min spatial resolution) global climatology data. Please note that this data is used to fill in a gap in available data for the Integrated Ecosystem Model (IEM) and does not constitute a complete or precise measurement of this variable in all locations.
RCPs: 8.5
Centers, Model Names, Versions, and Acronyms:
National Center for Atmospheric Research,Community Earth System Model 4,NCAR-CCSM4
Meteorological Research Institute,Coupled General Circulation Model v3.0,MRI-CGCM3
Methods of creating downscaled relative humidity data:
1. The GCM input data are distributed as relative humidity along with the CRU CL 2.0, therefore no conversion procedure was necessary before beginning the downscaling procedure.
2. Proportional Anomalies generated using the 20c3m Historical relative humidity data 1961-1990 climatology and the projected relative humidity data (2006-2100).
3. These proportional anomalies are interpolated using a spline interpolation to a 10min resolution grid for downscaling with the CRU CL 2.0 Relative Humidity Data.
4. The GCM proportional anomalies are multiplied by month to the baseline CRU CL 2.0 10min relative humidity climatology for the period 1961-1990. Creating a downscaled relative humidity projected time series 2006-2100.
5. Due to the conversion procedure and the low quality of the input data to begin with, there were values that fell well outside of the range of acceptable relative humidity (meaning that there were values >100 percent), these values were re-set to a relative humidity of 95 at the suggestion of the researchers involved in the project. It is well known that the CRU data is spotty for Alaska and the Circumpolar North, due to a lack of weather stations and poor temporal coverage for those stations that exist.
6. The desired output resolution for the AIEM modeling project is 1km, so the newly created downscaled time series is resampled to this resolution using a standard bilinear interpolation resampling procedure.
7. The final step was to convert the downscaled relative humidity data to vapor pressure using the calculation below, which uses a downscaled temperature data set created utilizing the same downscaling procedure.
EQUATION:
saturated vapor pressure = 6.112 x exp(17.62 x temperature/(243.12+temperature))
vapor pressure = (relative humidity x saturated vapor pressure)/100
Simple
- Date (Revision)
- 2016-12-20
- Edition
- 1.0.0
- Purpose
- This data has been created for the sole purpose of required model input in the Alaska Integrated Ecosystem Model (AIEM). It is not recommended to use this data as a precise representation of vapor pressure.
- Credit
- Michael Lindgren
- Credit
- Stephanie McAfee
- Credit
- Tom Kurkowski
- Credit
- This research is funded by the Arctic Landscape Conservation Cooperative, Western Alaska Landscape Conservation Cooperative, and Northwest Boreal Landscape Conservation Cooperative (LCCs) and the Alaska Climate Science Center.
- Status
- Completed
- Maintenance and update frequency
- Not planned
- Theme
-
- atmosphere
- atmospheric water vapor
- water vapor indicators
- vapor pressure
- projected
- modeled
- Keywords
-
- Use constraints
- License
- Other constraints
- https://creativecommons.org/licenses/by/4.0/
- Spatial representation type
- Grid
- Denominator
- 300000
- Metadata language
- eng
- Character set
- UTF8
- Topic category
-
- Climatology, meteorology, atmosphere
- Begin date
- 2006-01-15
- End date
- 2100-12-15
))
- Reference system identifier
- NAD83 Alaska Albers
- Number of dimensions
- 2
- Dimension name
- Row
- Dimension size
- 2223
- Resolution
- 1000 meters
- Dimension name
- Column
- Dimension size
- 5528
- Resolution
- 1000 meters
- Cell geometry
- Area
- Distribution format
-
-
GeoTIFF
(
1.1
)
-
GeoTIFF
(
1.1
)
- OnLine resource
-
Projected Monthly Vapor Pressure AR5 RCP 8.5
(
WWW:LINK-1.0-http--link
)
URL to web-accessible folder containing downloads for this data set.
- Hierarchy level
- Dataset
- Statement
- Due to the conversion procedure and the low quality of the input data to begin with, there were values that fell well outside of the range of acceptable relative humidity (meaning that there were values >100 percent), these values were re-set to a relative humidity of 95 at the suggestion of the researchers involved in the project. It is well known that the CRU data is spotty for Alaska and the Circumpolar North, due to a lack of weather stations and poor temporal coverage for those stations that exist.
- File identifier
- 2d7311ec-01fe-43ab-b36c-3a3a444c16ff XML
- Metadata language
- English
- Character set
- UTF8
- Date stamp
- 2022-08-18T10:22:03
- Metadata standard name
- ISO 19115:2003/19139
- Metadata standard version
- 1.0
Overviews
Spatial extent
Provided by
