SNAP GeoNetwork
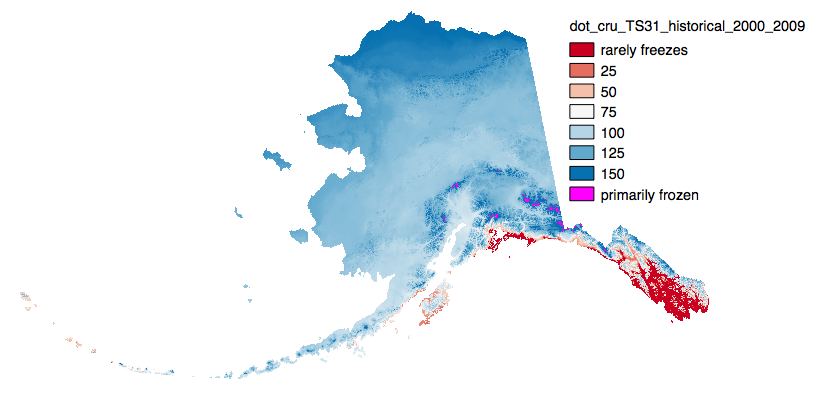
Historical Derived DOF/DOT/LOGS - 771m CRU TS
Simple
- Date (Publication)
- 2012-05-08
- Credit
- Matthew Leonawicz
- Credit
- Michael Lindgren
- Credit
- Tom Kurkowski
- Credit
- John Walsh
- Credit
- Scott Rupp
- Status
- Completed
- Maintenance and update frequency
- As needed
- Theme
-
- thaw
- freeze
- growing season
- historical
- modeled
- Use constraints
- License
- Other constraints
- https://creativecommons.org/licenses/by/4.0/
- Spatial representation type
- Grid
- Distance
- 771 m
- Metadata language
- eng
- Character set
- UTF8
- Topic category
-
- Climatology, meteorology, atmosphere
- Begin date
- 1900-01-15
- End date
- 2009-12-31
))
- Supplemental Information
-
Day of freeze or thaw units are ordinal day 15-350 with the below special cases.
Day of Freeze (DOF)
0 = Primarily Frozen
365 = Rarely Freezes
Day of Thaw (DOT)
0 = Rarely Freezes
365 = Primarily Frozen
Length of Growing Season (LOGS)* is simply the number of days between the DOT and DOF
The spatial extent includes Alaska.
Each set of files originates from the Climatic Research Unit (CRU, http://www.cru.uea.ac.uk/ ) TS 3.0 or 3.1 dataset. TS 3.0 extends through December 2006 while 3.1 extends to December 2009.
Day of Freeze, Day of Thaw, Length of Growing Season calculations:
Estimated ordinal days of freeze and thaw are calculated by assuming a linear change in temperature between consecutive months. Mean monthly temperatures are used to represent daily temperature on the 15th day of each month. When consecutive monthly midpoints have opposite sign temperatures, the day of transition (freeze or thaw) is the day between them on which temperature crosses zero degrees C. The length of growing season refers to the number of days between the days of thaw and freeze.
This amounts to connecting temperature values (y-axis) for each month (x-axis) by line segments and solving for the x-intercepts. Calculating a day of freeze or thaw is simple. However, transitions may occur several times in a year, or not at all. The choice of transition points to use as the thaw and freeze dates which best represent realistic bounds on a growing season is more complex. Rather than iteratively looping over months one at a time, searching from January forward to determine thaw day and from December backward to determine freeze day, stopping as soon as a sign change between two months is identified, the algorithm looks at a snapshot of the signs of all twelve mean monthly temperatures at once, which enables identification of multiple discrete periods of positive and negative temperatures. As a result more realistic days of freeze and thaw and length of growing season can be calculated when there are idiosyncrasies in the data.
- Unique resource identifier
- EPSG:3338
- Number of dimensions
- 2
- Dimension name
- Row
- Dimension size
- 2557
- Resolution
- 771 m
- Dimension name
- Column
- Dimension size
- 4762
- Resolution
- 771 m
- Cell geometry
- Area
- Distribution format
-
-
GeoTIFF
(
1.0
)
-
GeoTIFF
(
1.0
)
- OnLine resource
- http://data.snap.uaf.edu/data/Base/AK_771m/historical/CRU_TS/Historical_Derived_DOF_DOT_LOGS_771m_CRU_TS ( WWW:LINK-1.0-http--link )
- Hierarchy level
- Dataset
- Statement
- SNAP downscaled data products are value added products that build off of other datasets that have been accepted by the scientific community as some of the highest quality climate data available.
- File identifier
- 5eeefaa1-3e9e-4f01-94f6-e8f4fbbfc9c4 XML
- Metadata language
- English
- Character set
- UTF8
- Date stamp
- 2023-10-26T12:15:17
- Metadata standard name
- ISO 19115:2003/19139
- Metadata standard version
- 1.0
Overviews
Spatial extent
Provided by