SNAP GeoNetwork
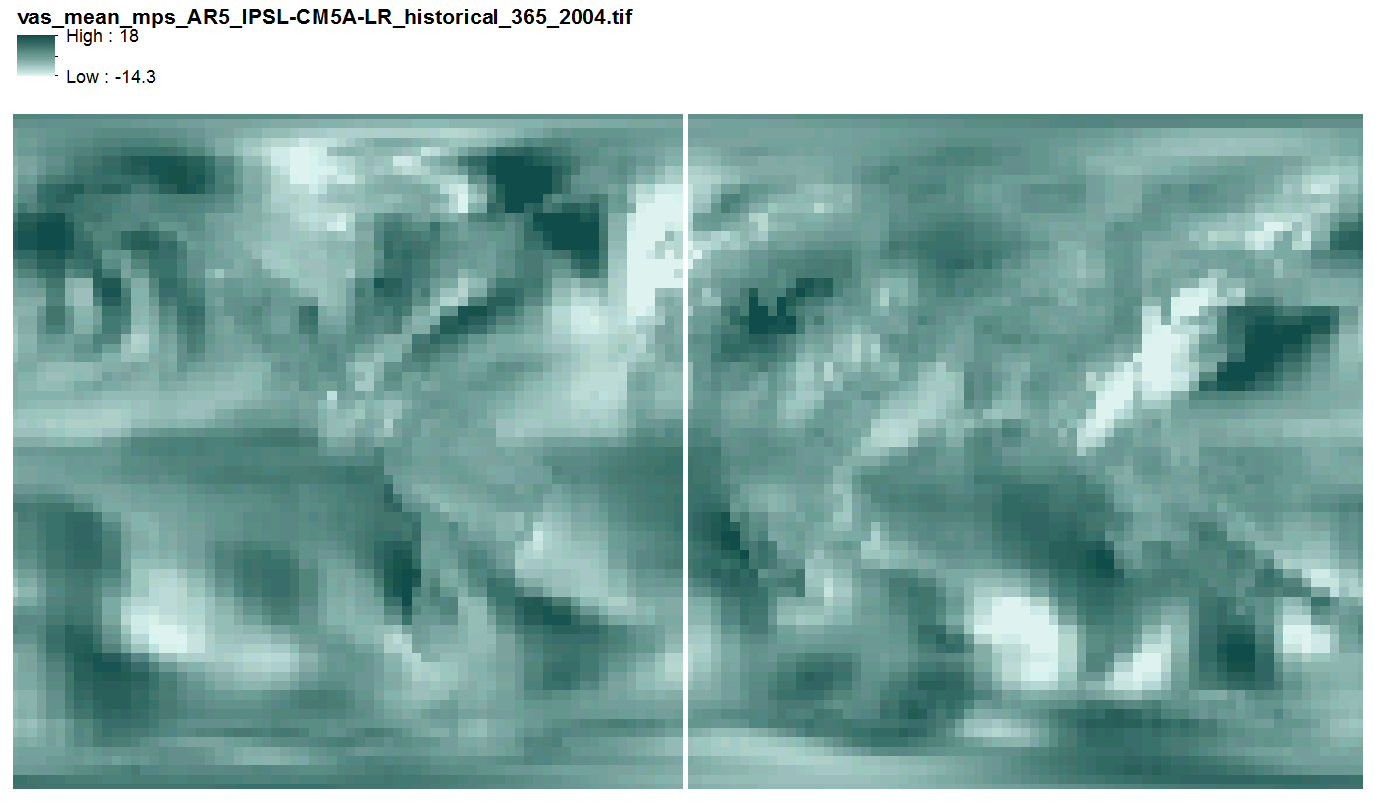
Historical and Projected Daily Quantile Mapped Near Surface Wind Velocity - 2.5 degrees CMIP5/AR5
Simple
- Date (Publication)
- 2015-05-15
- Credit
- Matthew Leonawicz
- Credit
- Angelica Floyd
- Credit
- Tom Kurkowski
- Credit
- Michael Lindgren
- Credit
- John Walsh
- Credit
- Scott Rupp
- Status
- On going
- Maintenance and update frequency
- As needed
- Theme
-
- wind
- historical
- projected
- modeled
- Use constraints
- License
- Other constraints
- https://creativecommons.org/licenses/by/4.0/
- Spatial representation type
- Grid
- Distance
- 2.5 degree
- Metadata language
- eng
- Character set
- UTF8
- Topic category
-
- Climatology, meteorology, atmosphere
- Begin date
- 1958-01-01
- End date
- 2100-12-31
))
- Supplemental Information
-
Variable info
uas: eastward component of wind, this value is positive if the wind is flowing from the west to the east
vas: northern component of wind, this value is positive if the wind is flowing from the south to the north
To combine the wind vectors, use the Pythagorean theorem. a^2 + b^2 = c^2
Specifications
Models used:
AR5 GCMs (historical runs, 1850-2005)
GFDL-CM3
IPSL-CM5A-LR
MRI-CGCM
RCPs (projected runs, 2006-2100)
6.0
8.5
Quantile mapping methodology
GCMs were quantile-mapped with respect to 1958-2001 ERA-40 reanalysis data by various methods as documented in:
Gudmundsson, L., Bremnes, J. B., Haugen, J. E., and Engen Skaugen, T.: Technical Note: Downscaling RCM precipitation to the station scale using quantile mapping – a comparison of methods, Hydrol. Earth Syst. Sci. Discuss., 9, 6185-6201, doi:10.5194/hessd-9-6185-2012, 2012.
A similar comparison of methods was made and the Local Linear Least Squares Regression quantile mapping method, available in the R package 'qmap', was chosen as the most appropriate method. Deltas resulting from the mapping were then applied to 2002-2100 GCM output to complete the 1958-2100 quantile-mapped GCM products.
http://www.ecmwf.int/products/data/archive/descriptions/e4/index.html
http://cran.r-project.org/web/packages/qmap/index.html
Model selection methodology
Per _Walsh et al. 2008. Global Climate Model Performance over Alaska and Greenland. Journal of Climate. v. 21 pp. 6156-6174._
Model selection used in AR5 products is more rigorous, and a publication is in preparation (Leonawicz M. and Walsh J. 20xx).
- Unique resource identifier
- EPSG:4326
- Number of dimensions
- 3
- Dimension name
- Time
- Dimension size
- 365
- Resolution
- 1 day
- Dimension name
- Row
- Dimension size
- 73
- Resolution
- 2.5 degree
- Dimension name
- Column
- Dimension size
- 144
- Resolution
- 2.5 degree
- Cell geometry
- Area
- Distribution format
-
-
GeoTIFF
(
1.0
)
-
GeoTIFF
(
1.0
)
- OnLine resource
- ckan.snap.uaf.edu/dataset/historical-and-projected-daily-quantile-mapped-near-surface-wind-velocity-2-5-degrees-cmip5-ar ( WWW:LINK-1.0-http--link )
- Hierarchy level
- Dataset
- Statement
- SNAP downscaled data products are value added products that build off of other datasets that have been accepted by the scientific community as some of the highest quality climate data available. Please see www.snap.uaf.edu to explore how our data is produced.
- File identifier
- 61aa24e9-87f9-4252-a751-672e7a268eed XML
- Metadata language
- English
- Character set
- UTF8
- Date stamp
- 2022-08-18T10:18:41
- Metadata standard name
- ISO 19115:2003/19139
- Metadata standard version
- 1.0
Overviews
Spatial extent
Provided by