SNAP GeoNetwork
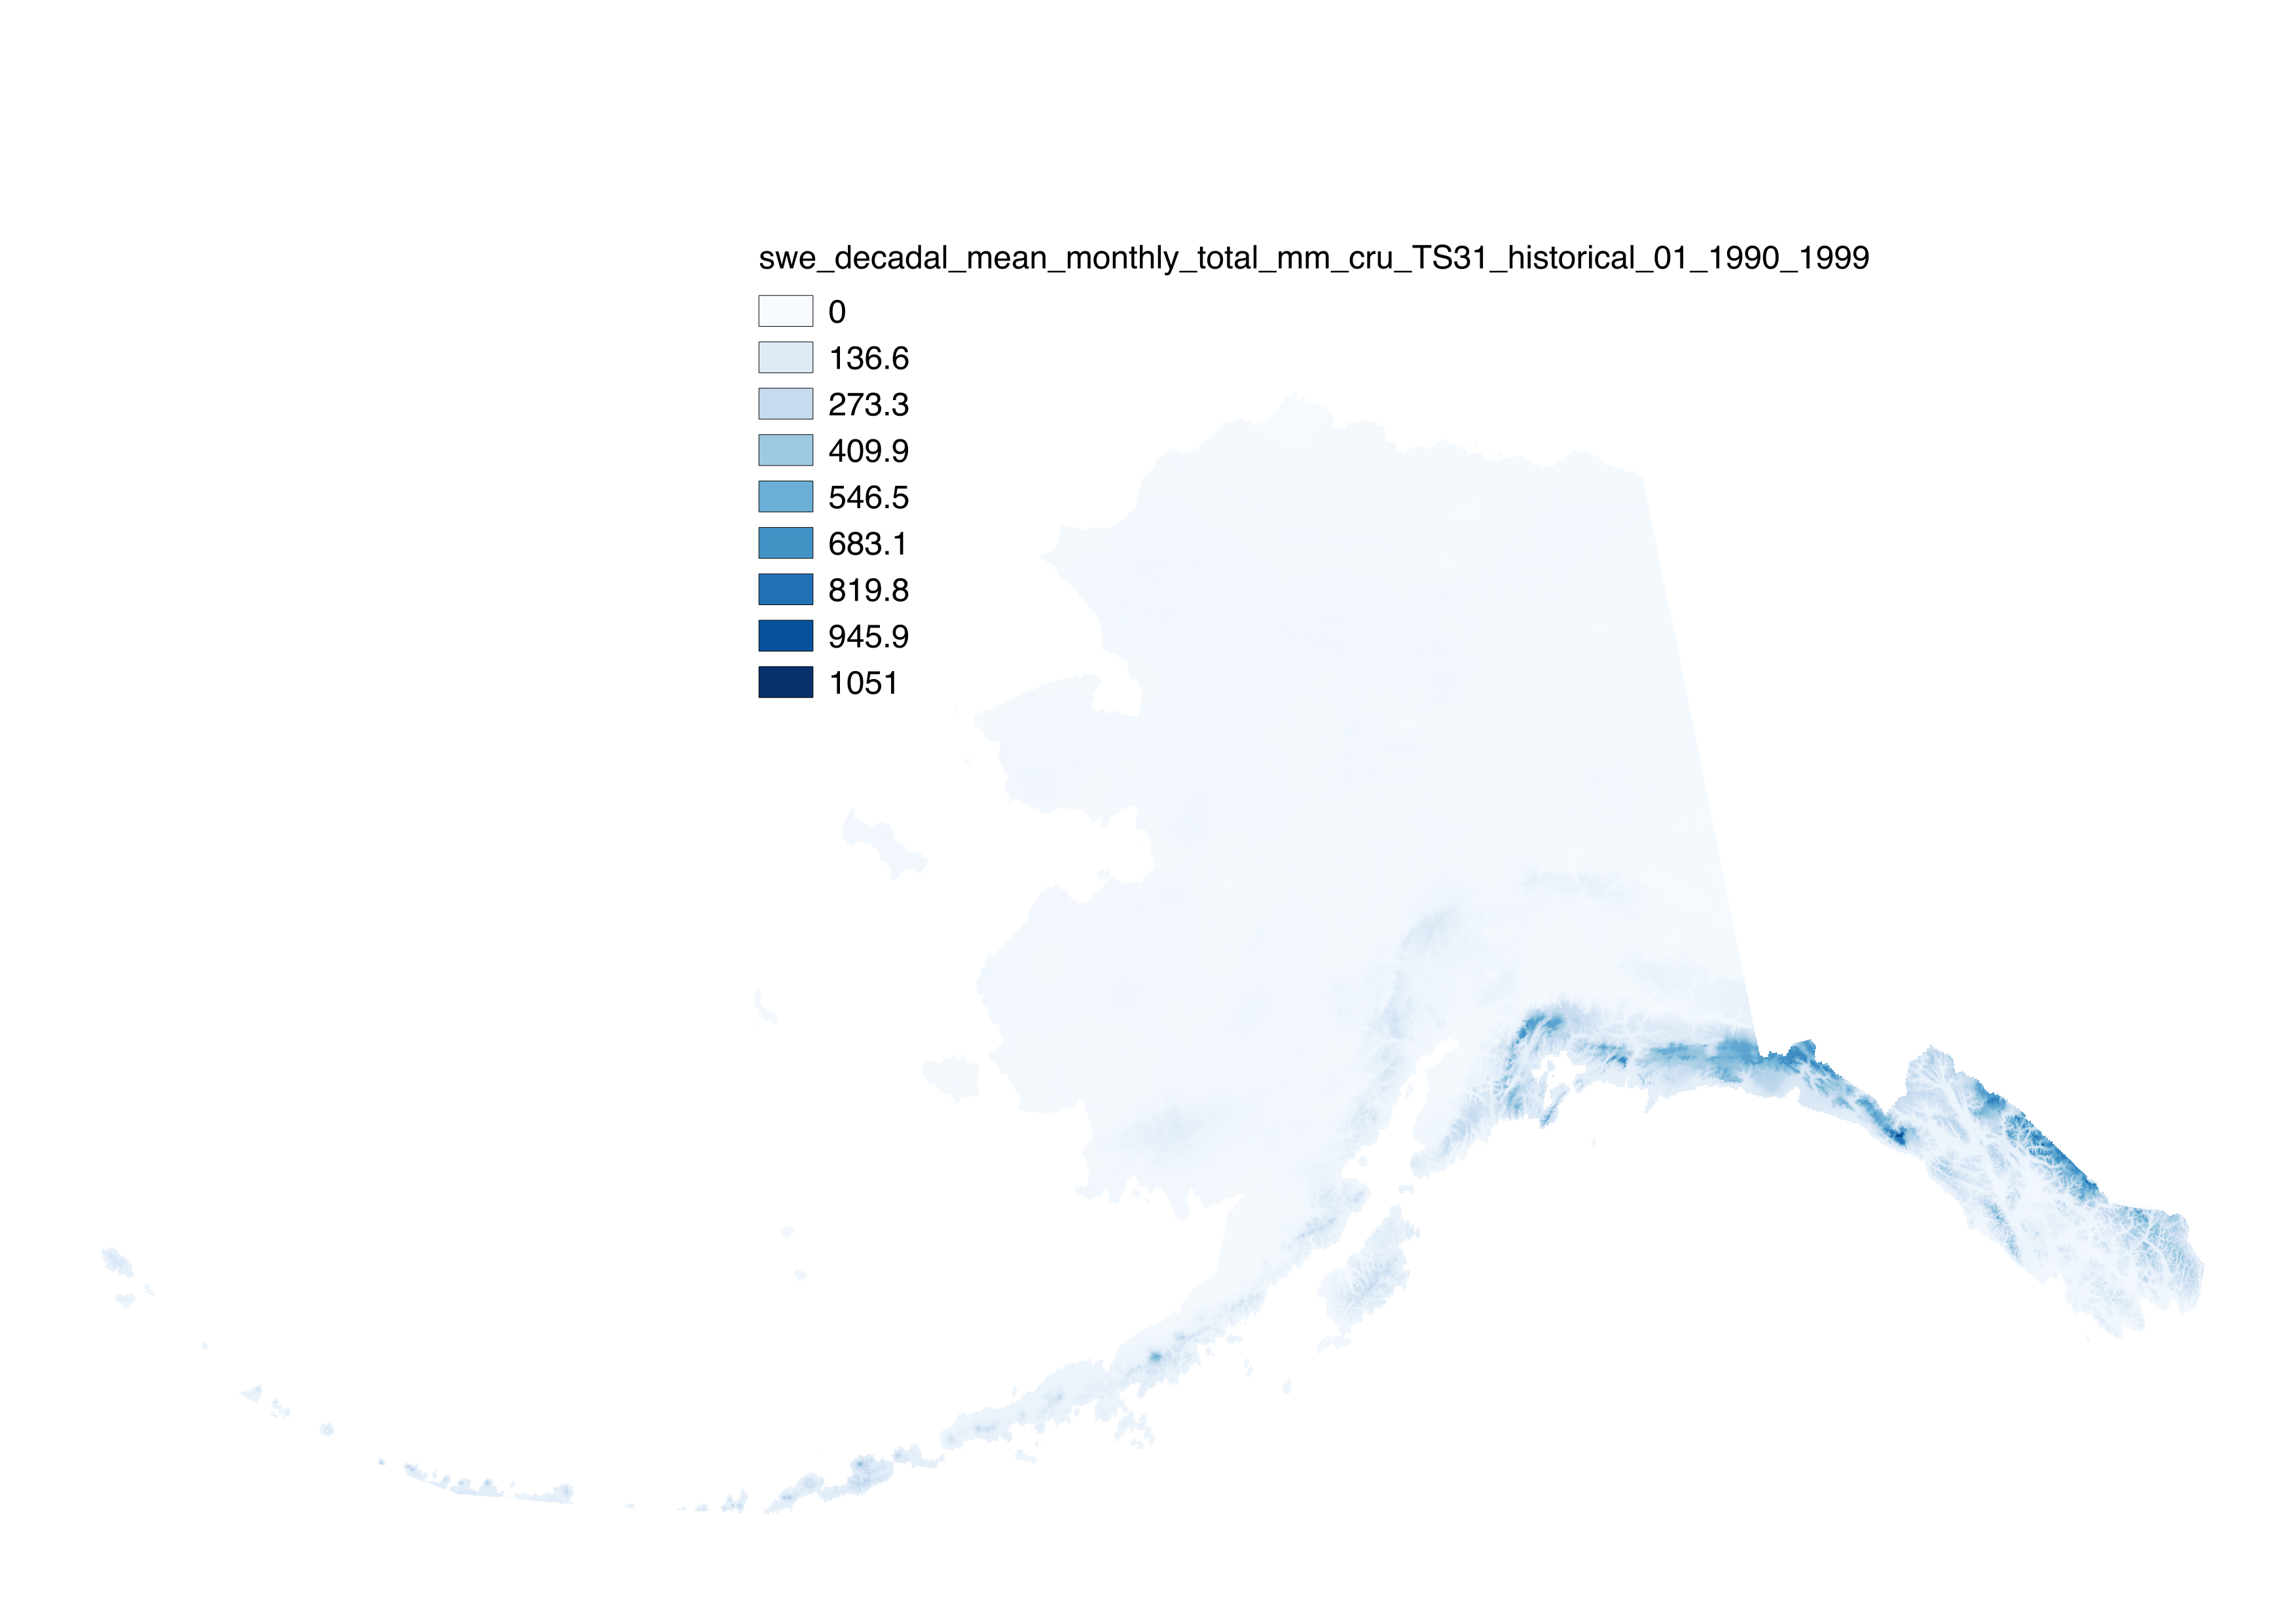
Historical Decadal Averages of Monthly Snow-Day Fraction 771m CRU TS3.0/3.1
These files include historical downscaled estimates of decadal average monthly snow-day fraction ("fs", units = percent probability from 1 – 100) for each month of the decades from 1900-1909 to 2000-2009 at 771 x 771 m spatial resolution. Each file represents a decadal average monthly mean. Version 1.0 was completed in 2015 using CMIP3. Version 2.0 was completed in 2018 using CMIP5.
For more information on the methodology used to create this dataset, and guidelines for appropriate usage of the dataset, please see the data user's guide here: http://data.snap.uaf.edu/data/Base/AK_771m/historical/CRU_TS/snow_day_fraction/snow_fraction_data_users_guide.pdf
Simple
- Date (Publication)
- 2018-05-22
- Credit
- Matthew Leonawicz
- Credit
- Michael Lindgren
- Credit
- Tom Kurkowski
- Credit
- John Walsh
- Credit
- Scott Rupp
- Credit
- Stephanie McAfee
- Credit
- Jeremy Littell
- Status
- Completed
- Maintenance and update frequency
- As needed
- Theme
-
- snow
- historical
- modeled
- precipitation
- Use constraints
- License
- Other constraints
- https://creativecommons.org/licenses/by/4.0/
- Spatial representation type
- Grid
- Distance
- 771 m
- Metadata language
- eng
- Character set
- UTF8
- Topic category
-
- Climatology, meteorology, atmosphere
- Begin date
- 1901-01-15
- End date
- 2009-12-15
))
- Supplemental Information
-
These files include historical downscaled estimates of decadal average monthly snow-day fraction ("fs", units = percent probability from 1 – 100) for each month of the decades from 1900-1909 to 2000-2009 at 771 x 771 m spatial resolution. Each file represents a decadal average monthly mean.
Version 1.0 was completed in 2015
Version 2.0 was completed in 2018
These snow-day fraction estimates were produced by applying equations relating decadal average monthly temperature to snow-day fraction to downscaled decadal average monthly temperature. Separate equations were used to model the relationship between decadal monthly average temperature and the fraction of wet days with snow for seven geographic regions in the state: Arctic, Western Alaska, Interior, Cook Inlet, SW Islands, SW Interior, and the Gulf of Alaska coast, using regionally specific logistic models of the probability that precipitation falls as snow given temperature based on station data fits as in McAfee et al. 2014.
Although the equations developed here provide a reasonable fit to the data, model evaluation demonstrated that some stations are consistently less well described by regional models than others. It is unclear why this occurs, but it is likely related to localized climate conditions. Very few weather stations with long records are located above 500m elevation in Alaska, so the equations used here were developed primarily from low-elevation weather stations. It is not clear whether the equations will be completely appropriate in the mountains. Finally, these equations summarize a long-term monthly relationship between temperature and precipitation type that is the result of short-term weather variability. In using these equations to make projections of future snow, as assume that these relationships remain stable over time, and we do not know how accurate that assumption is.
These snow-day fraction estimates were produced by applying equations relating decadal average monthly temperature to snow-day fraction to downscaled decadal average monthly temperature. The equations were developed from daily observed climate data in the Global Historical Climatology Network. These data were acquired from the National Climatic Data Center in early 2012. Equations were developed for the seven climate regions described in Perica et al. (2012). Geospatial data describing those regions was provided by Sveta Stuefer.
Temperature data used can be found here:
http://ckan.snap.uaf.edu/dataset/historical-monthly-and-derived-temperature-products-771m-cru-ts
Perica, S., D. Kane, S. Dietz, K. Maitaria, D. Martin, S. Pavlovic, I. Roy, S. Stuefer, A. Tidwell, C. Trypaluk, D. Unruh, M. Yekta, E. Betts, G. Bonnin, S. Heim, L. Hiner, E. Lilly, J. Narayanan, F.Yan, T. Zhao. 2012. NOAA Atlas 14. Precipitation-Frequency Atlas of the United States.
Note: In Littell et al. 2018, "fs" is referred to as "PSF"
- Unique resource identifier
- EPSG:3338
- Number of dimensions
- 3
- Dimension name
- Row
- Dimension size
- 2557
- Resolution
- 771 m
- Dimension name
- Column
- Dimension size
- 4762
- Resolution
- 771 m
- Cell geometry
- Area
- Distribution format
-
-
GeoTIFF
(
1.0
)
-
GeoTIFF
(
1.0
)
- OnLine resource
- http://data.snap.uaf.edu/data/Base/AK_771m/historical/CRU_TS/snow_day_fraction/ ( WWW:LINK-1.0-http--link )
- Hierarchy level
- Dataset
- Statement
- SNAP downscaled data products are value added products that build off of other datasets that have been accepted by the scientific community as some of the highest quality climate data available. Please see www.snap.uaf.edu to explore how our data is produced.
- File identifier
- 7c7a5534-3150-47c8-b959-f7aceb8e6b50 XML
- Metadata language
- English
- Character set
- UTF8
- Date stamp
- 2024-12-17T13:25:49
- Metadata standard name
- ISO 19115:2003/19139
- Metadata standard version
- 1.0
Overviews
Spatial extent
Provided by