 SNAP GeoNetwork
International Arctic Research Center (IARC), University of Alaska Fairbanks
Type of resources
Topics
Keywords
Contact for the resource
Provided by
Years
Representation types
Update frequencies
status
-
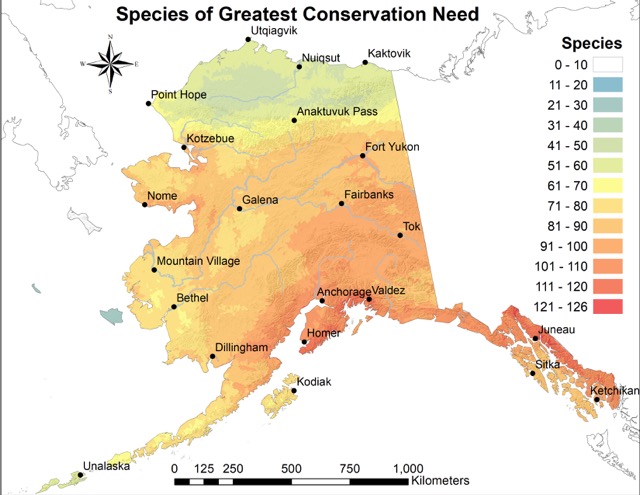
This dataset represents the results of a project that compiled available range information for three taxonomic groups representing 211 species (159 birds, 45 mammals, and 5 amphibians) identified as Species of Greatest Conservation Need (SGCN) by the 2015 Alaska Wildlife Action Plan (SWAP) Appendix A (https://www.adfg.alaska.gov/index.cfm?adfg=wildlifediversity.swap) in addition to 2 amphibian species native to Alaska. The goal of this effort was to create an initial set of statewide heatmaps of SGCN richness. Files include: (1) a set of 21 species richness heat maps depicting the sum of overlapping range maps from multiple SGCNs; (2) shapefiles of species range maps for Alaska’s terrestrial SGCN, with all species ranked (high, moderately high, moderate, low) in terms of relative conservation and management priority based on the Alaska Species Ranking System (ASRS; https://accs.uaa.alaska.edu/wildlife/alaska-species-ranking-system); (3) shapefiles of species in decline for birds and marine mammals (as listed in SWAP Appendix A); and (4) a file that cross-walks each SGCN by species code, common name, and scientific name. Complete information describing how environmental variables correlated with species richness is provided in the final report (http://data.snap.uaf.edu/data/Base/Other/Species/State_Wildlife_Grant_Final_Report_20Sept24.pdf). Species richness maps were derived from species-specific, 6th-level hydrologic unit (HUC12) occupancy maps developed by the Alaska Gap Analysis Project (https://accscatalog.uaa.alaska.edu/dataset/alaska-gap-analysis-project). Hotspot maps highlight all HUCs containing more than 60% of considered amphibian species or 80% of the maximum number of co-occurring bird or mammal species. Species richness values were derived by summing the number of species with overlapping ranges. A gradient boosting machine algorithm quantified relationships between SGCN hotspots and a set of 24 climatic, topographic, and habitat predictors. It is important to note that species ranges are modeled and extrapolated from limited data. They may be affected by changes in our understanding of species' ranges, changes in taxonomy, and changes in what we consider to be the best tools and data for creating distribution models using presence-only data, and may overestimate actual ranges. These datasets and any associated maps and other products are intended to provide a landscape-level overview only. It is highly recommended that any use of these datasets be undertaken in conjunction with expert advice from the Alaska Department of Fish and Game (see contact information below).