 SNAP GeoNetwork
freeze
Type of resources
Topics
Keywords
Contact for the resource
Provided by
Years
Formats
Representation types
Update frequencies
status
Resolution
-
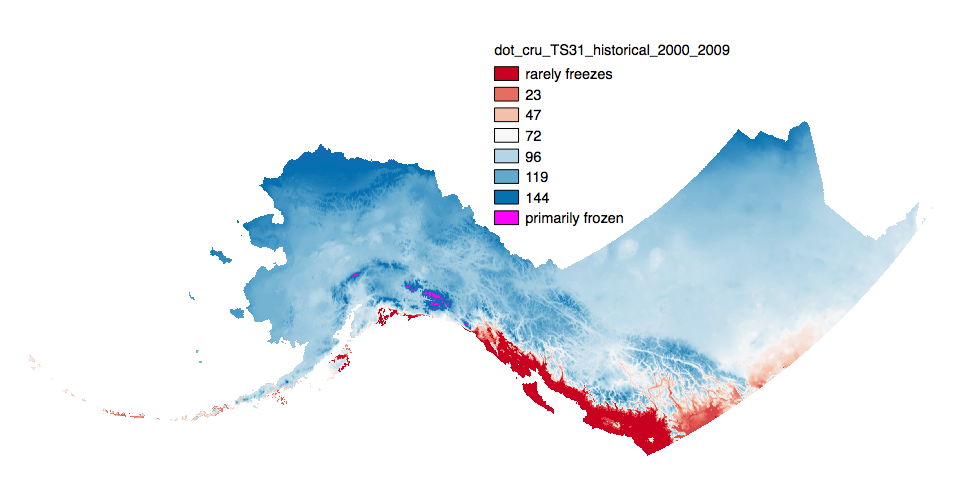
This set of files includes downscaled historical estimates of decadal means of annual day of freeze or thaw (ordinal day of the year), and length of growing season (numbers of days, 0-365) for each decade from 1910 - 2006 (CRU TS 3.0) or 2009 (CRU TS 3.1) at 2x2 kilometer spatial resolution. Each file represents a decadal mean of an annual mean calculated from mean monthly data. **Day of freeze or thaw units are ordinal day 15-350 with the below special cases.** *Day of Freeze (DOF)* `0` = Primarily Frozen `365` = Rarely Freezes *Day of Thaw (DOT)* `0` = Rarely Freezes `365` = Primarily Frozen *Length of Growing Season (LOGS)* is simply the number of days between the DOT and DOF. ---- The spatial extent includes Alaska, the Yukon Territories, British Columbia, Alberta, Saskatchewan, and Manitoba. Each set of files originates from the Climatic Research Unit (CRU, http://www.cru.uea.ac.uk/) TS 3.0 or 3.1 dataset. TS 3.0 extends through December 2006 while 3.1 extends to December 2009. **Day of Freeze, Day of Thaw, Length of Growing Season calculations:** Estimated ordinal days of freeze and thaw are calculated by assuming a linear change in temperature between consecutive months. Mean monthly temperatures are used to represent daily temperature on the 15th day of each month. When consecutive monthly midpoints have opposite sign temperatures, the day of transition (freeze or thaw) is the day between them on which temperature crosses zero degrees C. The length of growing season refers to the number of days between the days of thaw and freeze. This amounts to connecting temperature values (y-axis) for each month (x-axis) by line segments and solving for the x-intercepts. Calculating a day of freeze or thaw is simple. However, transitions may occur several times in a year, or not at all. The choice of transition points to use as the thaw and freeze dates which best represent realistic bounds on a growing season is more complex. Rather than iteratively looping over months one at a time, searching from January forward to determine thaw day and from December backward to determine freeze day, stopping as soon as a sign change between two months is identified, the algorithm looks at a snapshot of the signs of all twelve mean monthly temperatures at once, which enables identification of multiple discrete periods of positive and negative temperatures. As a result more realistic days of freeze and thaw and length of growing season can be calculated when there are idiosyncrasies in the data.
-
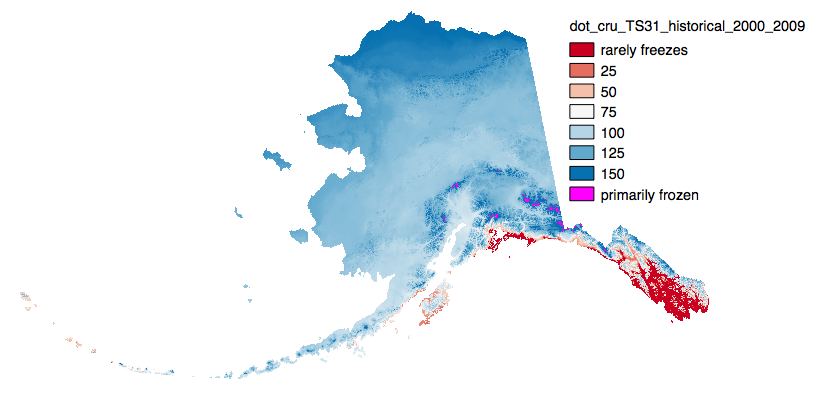
This set of files includes downscaled historical estimates of decadal means of annual day of freeze or thaw (ordinal day of the year), and length of growing season (numbers of days, 0-365) for each decade from 1910 - 2006 (CRU TS 3.0) or 2009 (CRU TS 3.1) at at 771 x 771 meter spatial resolution. Each file represents a decadal mean of an annual mean calculated from mean monthly data.
-

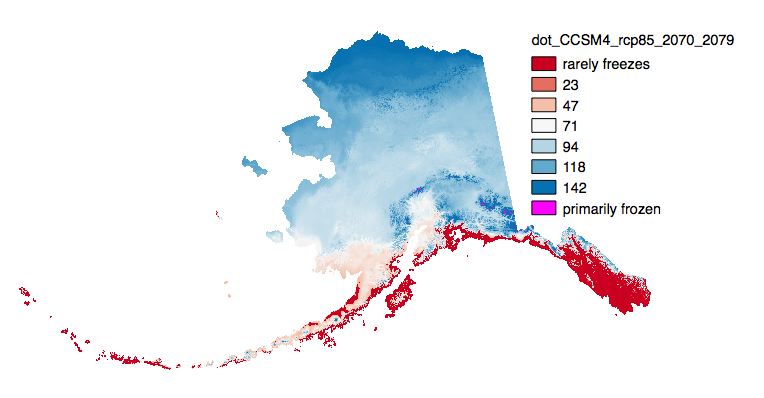
This set of files includes downscaled projections of decadal means of annual day of freeze or thaw (ordinal day of the year), and length of growing season (numbers of days, 0-365) for each decade from 2010 - 2100 at 2km x 2km meter spatial resolution. Each file represents a decadal mean of an annual mean calculated from mean monthly data. ---- The spatial extent includes Alaska, the Yukon Territory, British Columbia, Alberta, Saskatchewan, and Manitoba. Each set of files originates from one of five top ranked global circulation models from the CMIP5/AR5 models and RPCs, or is calculated as a 5 Model Average. Day of Freeze, Day of Thaw, Length of Growing Season calculations: Estimated ordinal days of freeze and thaw are calculated by assuming a linear change in temperature between consecutive months. Mean monthly temperatures are used to represent daily temperature on the 15th day of each month. When consecutive monthly midpoints have opposite sign temperatures, the day of transition (freeze or thaw) is the day between them on which temperature crosses zero degrees C. The length of growing season refers to the number of days between the days of thaw and freeze. This amounts to connecting temperature values (y-axis) for each month (x-axis) by line segments and solving for the x-intercepts. Calculating a day of freeze or thaw is simple. However, transitions may occur several times in a year, or not at all. The choice of transition points to use as the thaw and freeze dates which best represent realistic bounds on a growing season is more complex. Rather than iteratively looping over months one at a time, searching from January forward to determine thaw day and from December backward to determine freeze day, stopping as soon as a sign change between two months is identified, the algorithm looks at a snapshot of the signs of all twelve mean monthly temperatures at once, which enables identification of multiple discrete periods of positive and negative temperatures. As a result more realistic days of freeze and thaw and length of growing season can be calculated when there are idiosyncrasies in the data. Please note that these maps represent climatic estimates only. While we have based our work on scientifically accepted data and methods, uncertainty is always present . Uncertainty in model outputs tends to increase for more distant climatic estimates from present day for both historical summaries and future projections.
-
This set of files includes downscaled projections of decadal means of annual day of freeze or thaw (ordinal day of the year), and length of growing season (numbers of days, 0-365) for each decade from 2010 - 2100 at 771x771 meter spatial resolution. Each file represents a decadal mean of an annual mean calculated from mean monthly data. ---- The spatial extent includes Alaska. Each set of files originates from one of five top ranked global circulation models from the CMIP5/AR5 models and RPCs, or is calculated as a 5 Model Average. Day of Freeze, Day of Thaw, Length of Growing Season calculations: Estimated ordinal days of freeze and thaw are calculated by assuming a linear change in temperature between consecutive months. Mean monthly temperatures are used to represent daily temperature on the 15th day of each month. When consecutive monthly midpoints have opposite sign temperatures, the day of transition (freeze or thaw) is the day between them on which temperature crosses zero degrees C. The length of growing season refers to the number of days between the days of thaw and freeze. This amounts to connecting temperature values (y-axis) for each month (x-axis) by line segments and solving for the x-intercepts. Calculating a day of freeze or thaw is simple. However, transitions may occur several times in a year, or not at all. The choice of transition points to use as the thaw and freeze dates which best represent realistic bounds on a growing season is more complex. Rather than iteratively looping over months one at a time, searching from January forward to determine thaw day and from December backward to determine freeze day, stopping as soon as a sign change between two months is identified, the algorithm looks at a snapshot of the signs of all twelve mean monthly temperatures at once, which enables identification of multiple discrete periods of positive and negative temperatures. As a result more realistic days of freeze and thaw and length of growing season can be calculated when there are idiosyncrasies in the data.