 SNAP GeoNetwork
historical
Type of resources
Topics
Keywords
Contact for the resource
Provided by
Years
Formats
Representation types
Update frequencies
status
Resolution
-
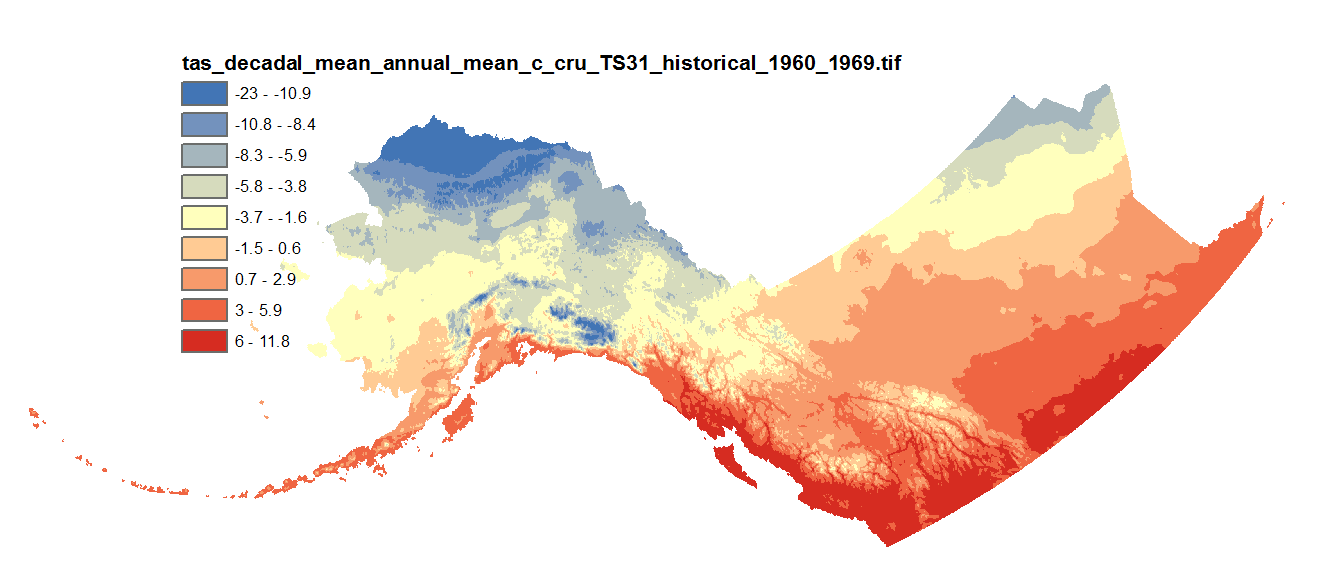
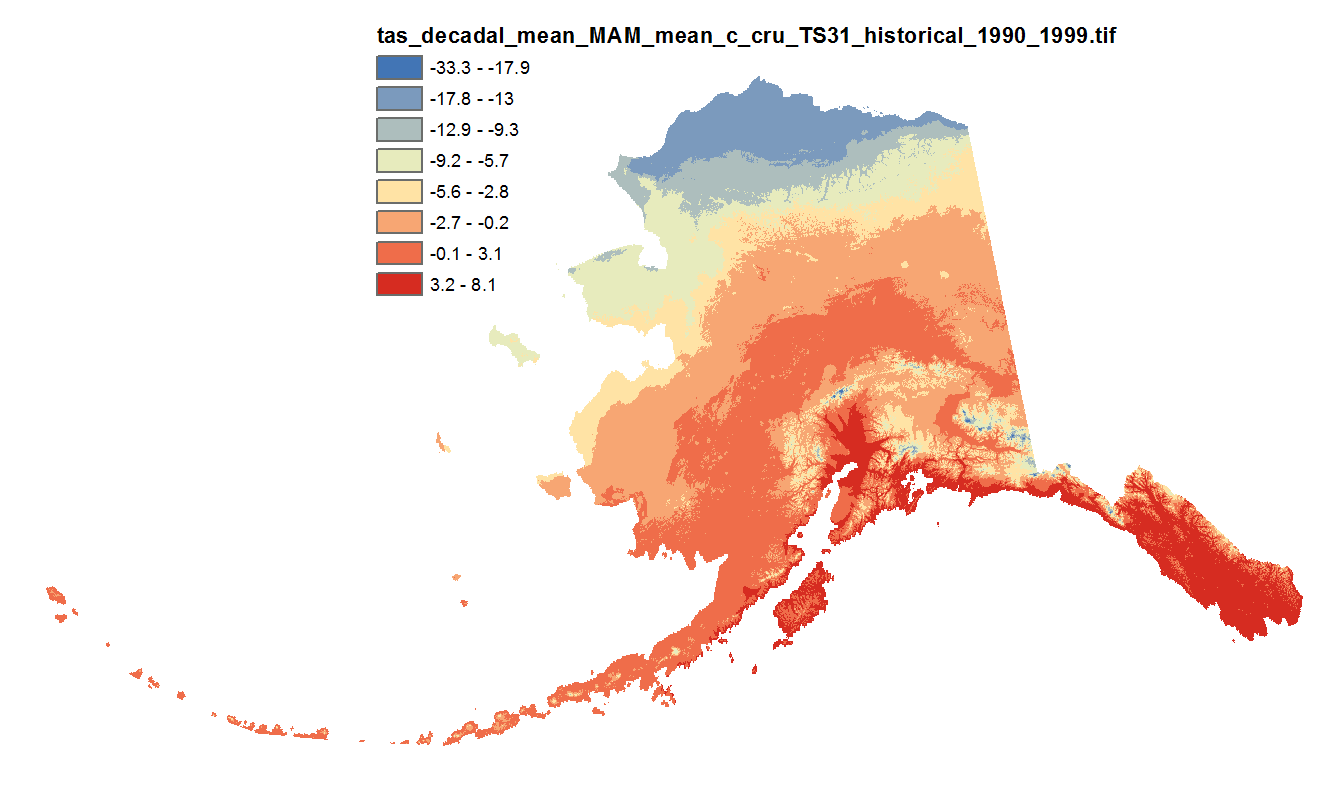
This dataset includes downscaled historical estimates of monthly average, minimum, and maximum temperature and derived annual, seasonal, and decadal means of monthly average temperature (in degrees Celsius, no unit conversion necessary) from 1901 to 2006 (CRU TS 3.0), 2009 (CRU TS 3.1), 2015 (CRU TS 4.0), 2020 (CRU TS 4.05), or 2023 (CRU TS 4.08) at 2km x 2km spatial resolution. CRU TS 4.0 is only available as monthly averages, minimum, and maximum files. CRU TS 4.05 and 4.08 are only available as monthly averages. The downscaling process utilizes PRISM climatological datasets from 1961-1990.
-
This set of files includes downscaled projections of monthly totals, and derived annual, seasonal, and decadal means of monthly average temperature (in degrees Celsius, no unit conversion necessary) from 1901 - 2006 (CRU TS 3.0) or 2009 (CRU TS 3.1) at 771 x 771 meter spatial resolution.
-
This dataset consists of sea ice indicators for the Arctic based on daily sea ice concentrations derived from satellite passive microwave measurements. The four indicators available are day of break-up start, day of break-up end, day of freeze-up start, and day of freeze-up end. These “day of year” values indicate the ordinal day of the ice-year on which the event occurred. The ice-year is defined as September 1 through August of the following year. Locally defined indicators can serve as key links between pan-Arctic or global indicators such as sea-ice extent or volume and local uses of sea ice, with the potential to inform community-scale adaptation and response.
-

These files include downscaled historical decadal average monthly snowfall equivalent ("SWE", in millimeters) for each month at 771 x 771 m spatial resolution. Each file represents a decadal average monthly mean. Historical data for 1910-1919 to 1990-1999 are available for CRU TS3.0-based data and for 1910-1919 to 2000-2009 for CRU TS3.1-based data.
-
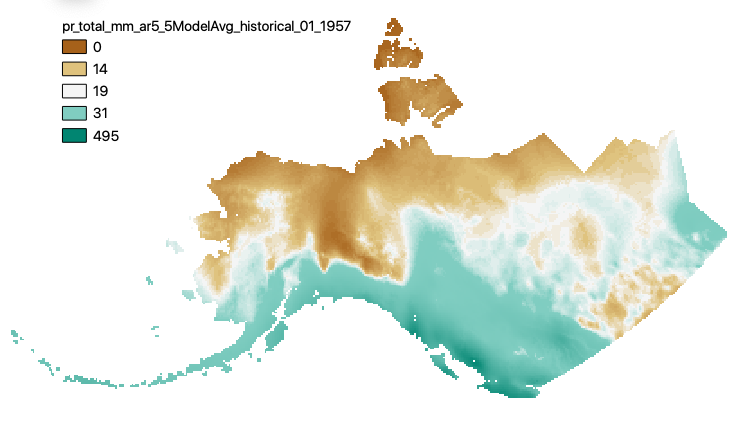
This set of files includes downscaled historical estimates of monthly total precipitation (in mm, no unit conversion necessary) from 1901 - 2005, at 15km x 15km spatial resolution. They include data for Alaska and Western Canada. Each set of files originates from one of five top ranked global circulation models from the CMIP5/AR5 models and RCPs, or is calculated as a 5 Model Average. These outputs are from the Historical runs of the GCMs. The downscaling process utilizes CRU CL v. 2.1 climatological datasets from 1961-1990 as the baseline for the Delta Downscaling method.
-
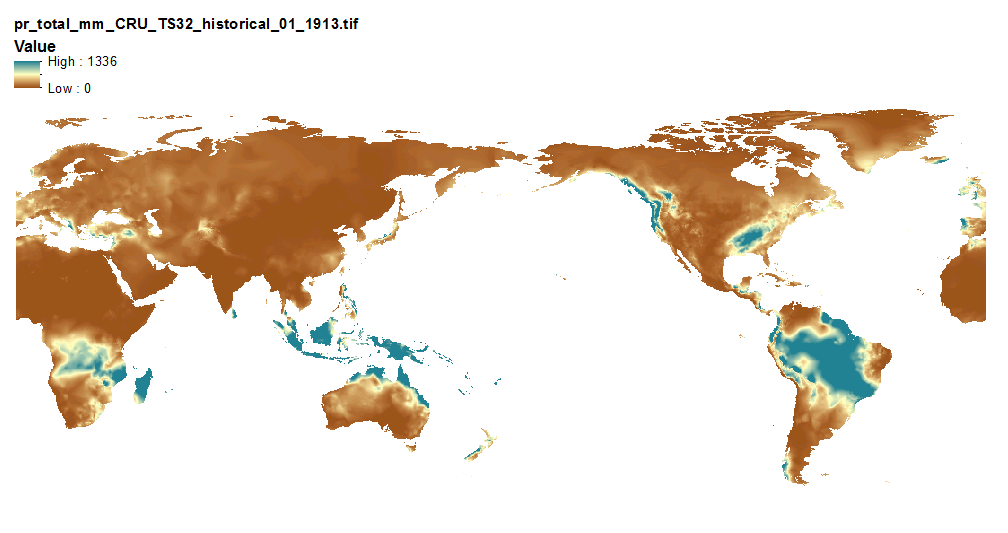
This set of files includes downscaled historical estimates of monthly total precipitation (in millimeters, no unit conversion necessary, rainwater equivalent) from 1901 - 2013 (CRU TS 3.22) at 10 min x 10 min spatial resolution with global coverage. The downscaling process utilizes CRU CL v. 2.1 climatological datasets from 1961-1990.
-
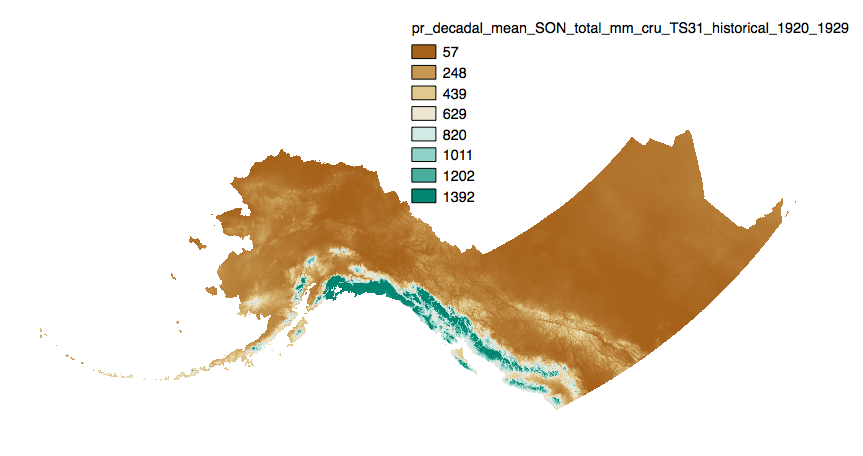
This dataset includes downscaled historical estimates of monthly average, minimum, and maximum precipitation and derived annual, seasonal, and decadal means of monthly total precipitation (in millimeters, no unit conversion necessary) from 1901 to 2006 (CRU TS 3.0), 2009 (CRU TS 3.1), 2015 (CRU TS 4.0), 2020 (CRU TS 4.05), or 2023 (CRU TS 4.08) at 2km x 2km spatial resolution. CRU TS 4.0 is only available as monthly averages, minimum, and maximum files. CRU TS 4.05 and 4.08 data are only available as monthly averages. The downscaling process utilizes PRISM climatological datasets from 1961-1990.
-

This set of files includes downscaled historical estimates of monthly total precipitation (in millimeters) at 1 kilometer spatial resolution. Each file represents a single month in a given year. The original SNAP downscaled precipitation product at 2 kilometer spatial resolution was resampled to 1 kilometer spatial resolution via bilinear interpolation to create these data for input to the Integrated Ecosystem Model (IEM). Please note that this data is used to fill in a gap in available data for the IEM and does not constitute a complete or precise measurement of this variable in all locations.
-
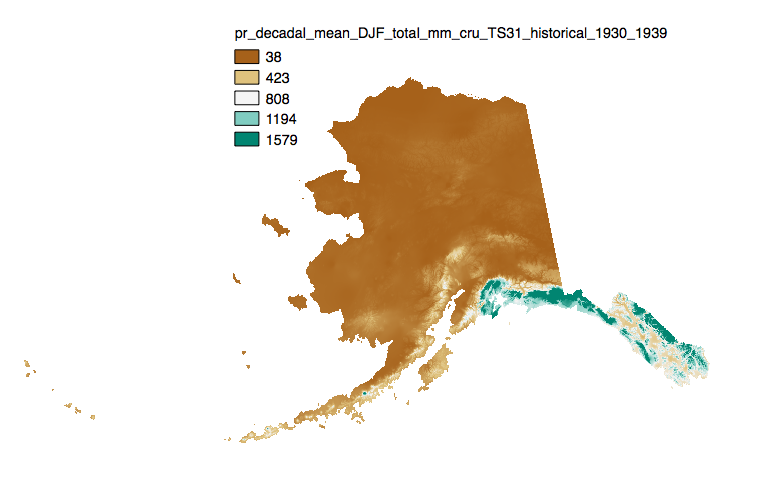
This set of files includes downscaled historical estimates of monthly totals, and derived annual, seasonal, and decadal means of monthly total precipitation (in millimeters, no unit conversion necessary) from 1901 - 2006 (CRU TS 3.0) or 2009 (CRU TS 3.1) at 771 x 771 meter spatial resolution.
-
This data set includes weekly (January 1954 to December 2013) and monthly (January 1850 to December 2022) midpoint historical sea ice concentration (0 - 100%) estimates at 1/4 x 1/4 degree spatial resolution for the ocean region around the state of Alaska, USA. This value-added dataset was developed by compiling the below historical data sources into spatially and temporally standardized datasets. Gaps in temporal or spatial resolutions were filled in with spatial and temporal analog month approaches. This dataset is no longer being updated. The NSIDC provides a new version in netCDF format receiving ongoing updates: https://nsidc.org/data/nsidc-0051/versions/2.