 SNAP GeoNetwork
2018
Type of resources
Topics
Keywords
Contact for the resource
Provided by
Years
Formats
Representation types
Update frequencies
status
Resolution
-

These files include climatological summaries of downscaled historical and projected decadal average monthly snowfall (i.e. snow-water) equivalent (SWE) in millimeters, the ratio of snowfall equivalent to precipitation, and future change in snowfall for October-March at 771-meter spatial resolution across the state of Alaska. Data are for summary October to March Alaska climatologies for: 1) historical and future snowfall equivalent (SWE), produced by multiplying snow-day fraction by decadal average monthly precipitation and summing over 6 months from October to March to estimate the total SWE on April 1. 2) historical and future ratio of SWE to precipitation (SFEtoP), SFEtoP is the ratio of October to March total SWE to October to March total precipitation is calculated as total SWE / total precipitation (expressed as percent, 0-100). 3) future change in snowfall equivalent relative to historical ("dSWE"), calculated as (SWE future – SWE historical) / SWE historical (no units, multiply by 100 to obtain percent). The historical reference period is 1970-1999, (file name “H70.99”), calculated from downscaled CRU TS 3.1 data Future climatologies (both RCP 4.5 and 8.5) are for: - 2020s (2010-2039) - 2050s (2040-2069) - 2080s (2070-2099) across 5 GCMs: NCAR-CCSM4, GFDL-CM3, GISS-E2-R, IPSL-CM5, and MRI-CGCM3 as well as a 5-model mean (“5MM”). Following Elsner et al. (2010), <0.1 is rain dominated, 0.1 < SFE:P < 0.4 is transitional, and >0.4 is snow dominated. Only calculated for historical reference climatology 1970-1999 and three future climatologies: 2010-2039, 2040-2069, and 2070-2090, with each climatology representing the mean of three decadal averages from the available decadal grids. Snow fraction data used can be found here: http://ckan.snap.uaf.edu/dataset/projected-decadal-averages-of-monthly-snow-day-fraction-771m-cmip5-ar5 http://ckan.snap.uaf.edu/dataset/historical-decadal-averages-of-monthly-snow-day-fraction-771m-cru-ts3-0-3-1 Precipitation data used can be found here: http://ckan.snap.uaf.edu/dataset/projected-monthly-and-derived-precipitation-products-771m-cmip5-ar5 http://ckan.snap.uaf.edu/dataset/historical-monthly-and-derived-precipitation-products-771m-cru-ts * Note: In Littell et al. 2018, "SWE" is referred to as "SFE", and "SFEtoP" as "SFE:P"
-
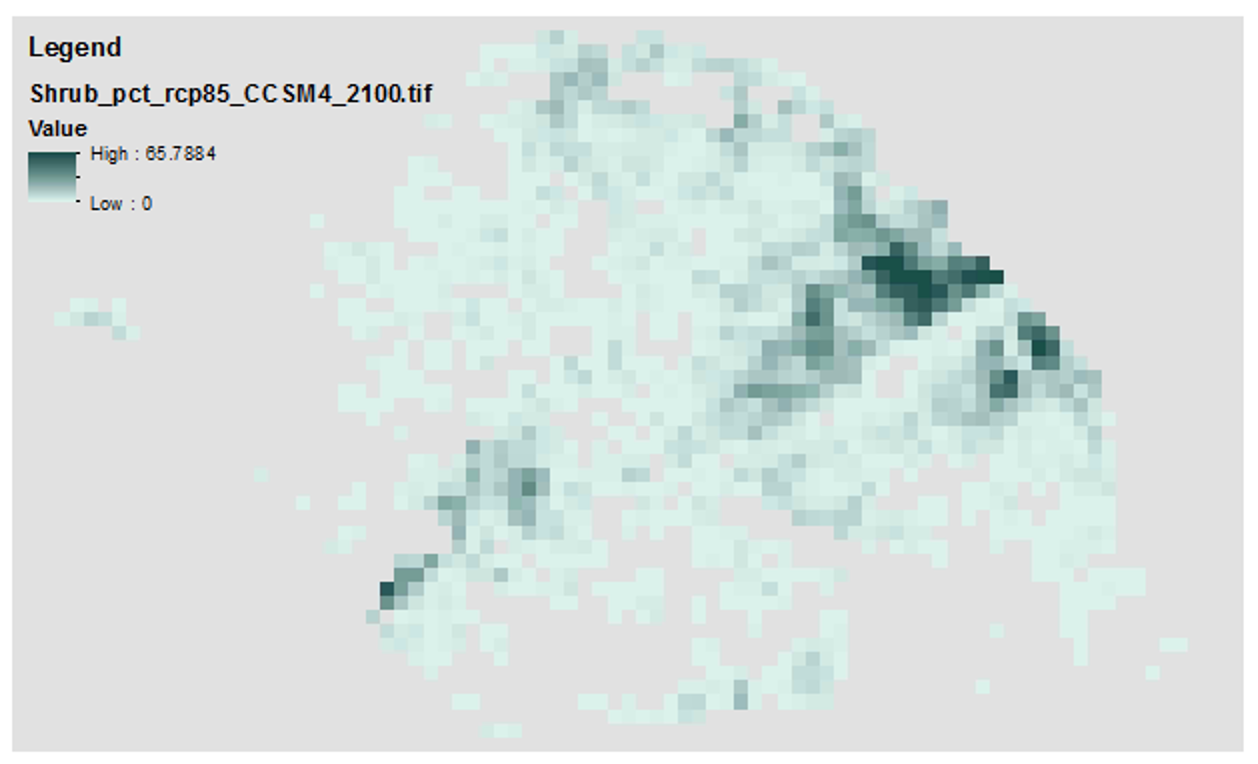
These data contain historical and future projections of percent land cover from 1950 to 2100, as simulated by the Alaska Thermokarst Model for the boreal region. The data are 1km spatial resolution. The climate data used to drive the model simulations are from the Climate Research Unit, Time Series 4.0 (CRU_TS40) for the historical period (1950 to 2015), and from RCP 8.5 and global circulation models NCAR-CCSM4 and MRI-CGCM3 for the projected period (2016 to 2100). Datasets from the years 1950, 2000, 2050, and 2100 are provided. Annual maps are available upon request. Please note that this data is used to fill in a gap in available data for the Integrated Ecosystem Model (IEM) and does not constitute a complete or precise measurement of this variable in all locations. If used for publication, these data should be cited as the following: Genet H., Lara M., McGuire A.D., Jorgenson T.M., Euskirchen E.S., Clein J., Carman T., Rutter R., Rupp S., Breen A., Kurkowski T., Bennett A., Torgenson B., Romanovski V., Marchenko S. 2018. Land cover dynamic in the Tanana Flats from 1950 to 2100 driven by thermokarst activity.
-
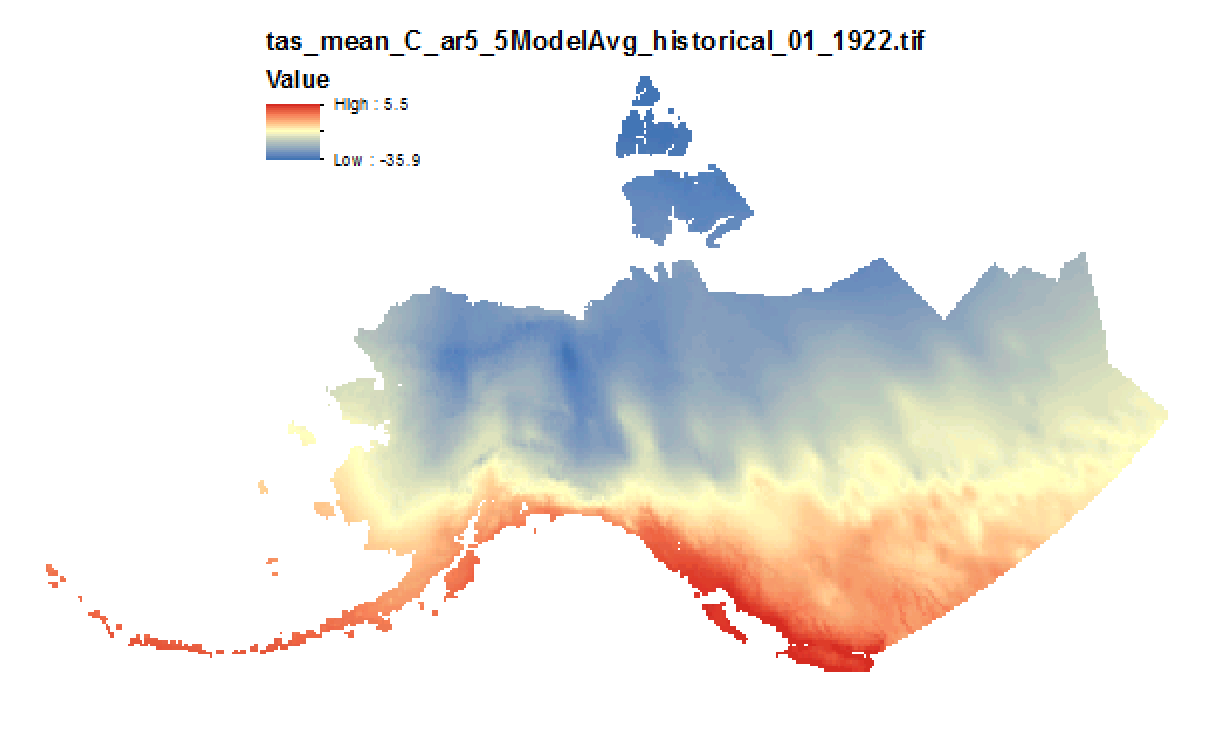
This set of files includes downscaled modeled historical estimates of monthly temperature (in degrees Celsius, no unit conversion necessary) from 1901 - 2005 at 15km x 15km spatial resolution. Each set of files originates from one of five top-ranked global circulation models from the CMIP5/AR5 models and RCPs or is calculated as a 5 Model Average. These outputs are from the Historical runs of the GCMs. The downscaling process utilizes CRU CL v. 2.1 climatological datasets from 1961-1990 as the baseline for the Delta Downscaling method.
-
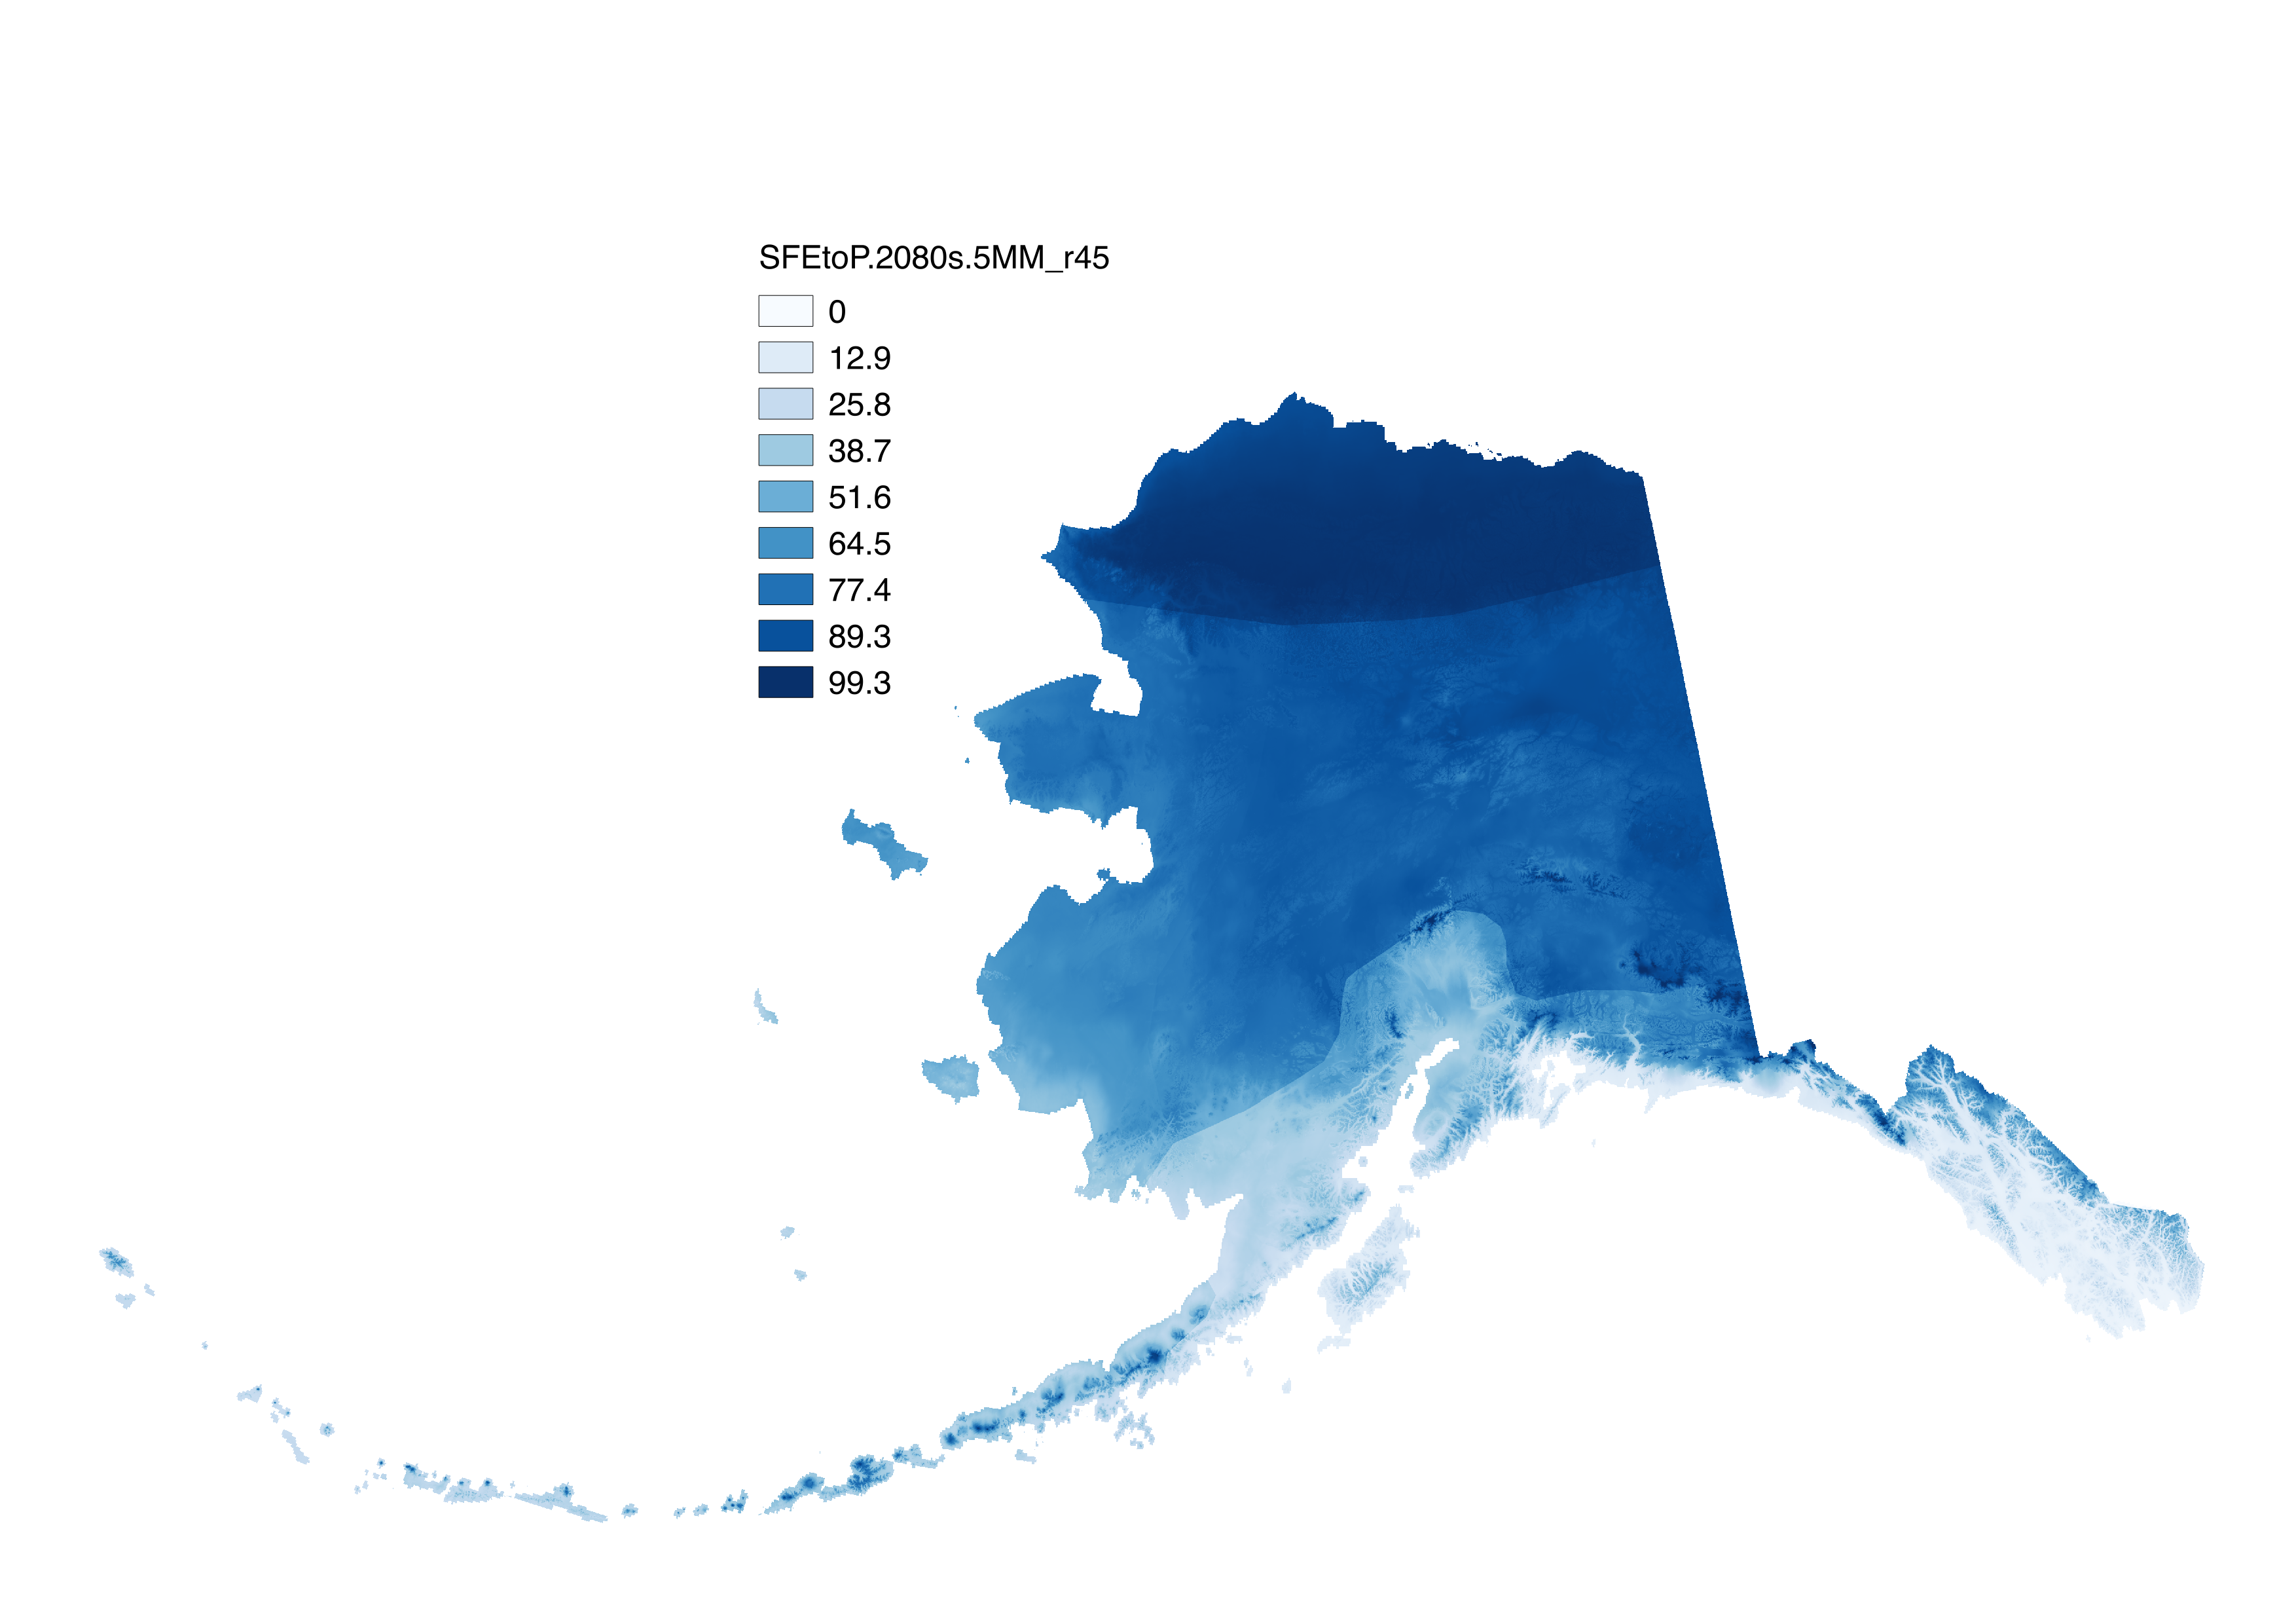
These files include climatological summaries of downscaled historical and projected decadal average monthly derived snow variables and summaries at 771 meter spatial resolution across Alaska. There are three types of files: 1). The historical and future snowfall water equivalent (SWE) in millimeters, produced by multiplying snow-day fraction by decadal average monthly precipitation and summing over 6 months from October to March to estimate the total SWE on April 1. 2). The historical and future ratio of SWE to total precipitation (SFEtoP) in percent. SFEtoP is calculated as (SWE / total precipitation) and also represents the six month October to March period. 3). The future difference in SWE with respect to the historical baseline (dSWE) in percent. dSWE is calculated as ((future SWE – historical SWE) / historical SWE) * 100. These data are also summary for the six month October to March period. The historical baseline period is 1970-1999, (file naming convention “H70.99”) and data are calculated from downscaled CRU TS 3.1 data. Projected variables exist for RCP 4.5 and RCP 8.5 emission scenarios and for 5 GCMs: NCAR-CCSM4, GFDL-CM3, GISS-E2-R, IPSL-CM5, and MRI-CGCM3. The 5-model mean (file naming convention "5MM") was also computed. Projections exist for three thirty-year climatologies: the 2020s (2010-2039), the 2050s (2040-2069), and the 2080s (2070-2099). The snow-day fraction data used can be found here: http://ckan.snap.uaf.edu/dataset/projected-decadal-averages-of-monthly-snow-day-fraction-771m-cmip5-ar5 http://ckan.snap.uaf.edu/dataset/historical-decadal-averages-of-monthly-snow-day-fraction-771m-cru-ts3-0-3-1 The precipitation data used can be found here: http://ckan.snap.uaf.edu/dataset/projected-monthly-and-derived-precipitation-products-771m-cmip5-ar5 http://ckan.snap.uaf.edu/dataset/historical-monthly-and-derived-precipitation-products-771m-cru-ts Note: In Littell et al. 2018, "SWE" is referred to as "SFE", and "SFEtoP" as "SFE:P"
-
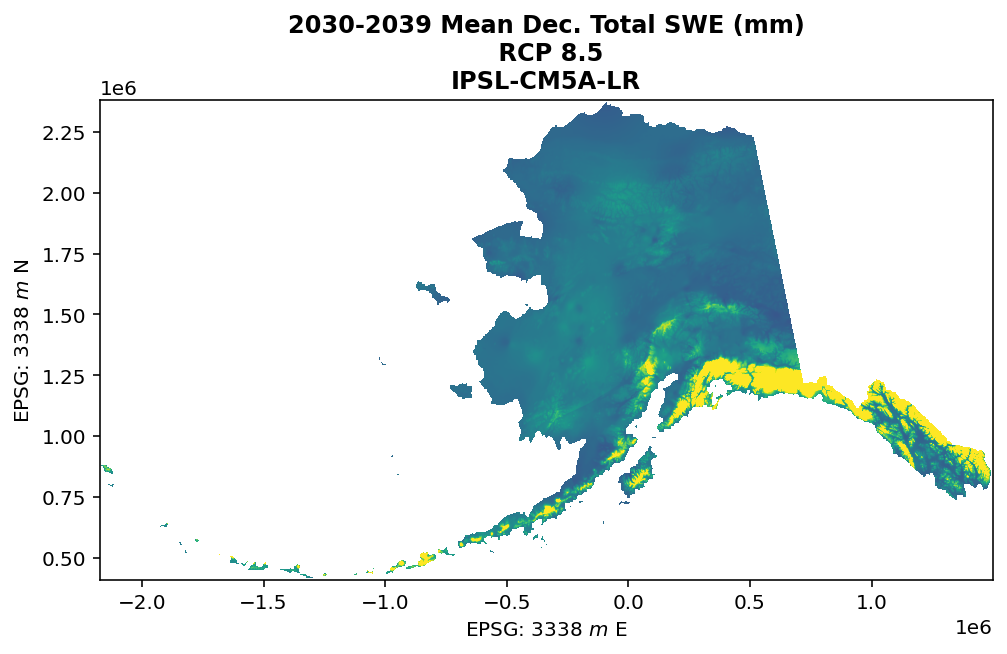
These files include downscaled projections of decadal average monthly snowfall (water) equivalent (SWE) in millimeters for each month of the decades from 2010-2019 to 2090-2099 at 771 x 771 m spatial resolution. Each file represents a decadal average monthly mean. Output is available for the NCAR-CCSM4, GFDL-CM3, GISS-E2-R, IPSL-CM5A-LR, and MRI-CGCM3 models and three emissions scenarios (RCP 4.5, RCP 6.0 and RCP 8.5). SWE estimates were produced by multiplying snow-day fraction ("fs") by decadal average monthly precipitation ("Pr") such that SWE = (fs * Pr) / 100
-
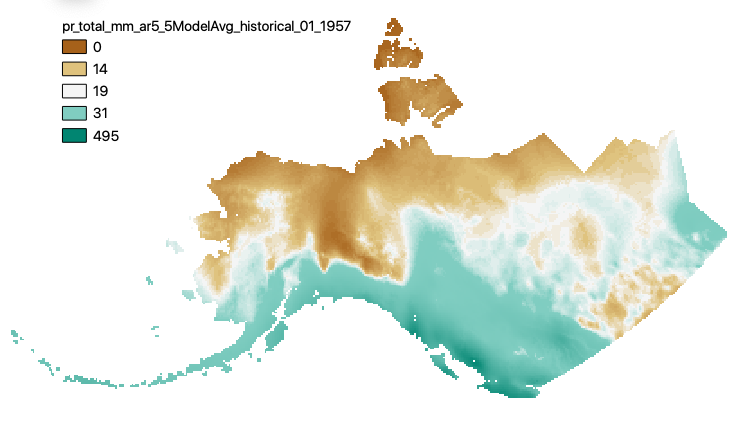
This set of files includes downscaled historical estimates of monthly total precipitation (in mm, no unit conversion necessary) from 1901 - 2005, at 15km x 15km spatial resolution. They include data for Alaska and Western Canada. Each set of files originates from one of five top ranked global circulation models from the CMIP5/AR5 models and RCPs, or is calculated as a 5 Model Average. These outputs are from the Historical runs of the GCMs. The downscaling process utilizes CRU CL v. 2.1 climatological datasets from 1961-1990 as the baseline for the Delta Downscaling method.