 SNAP GeoNetwork
CMIP5
Type of resources
Topics
Keywords
Contact for the resource
Provided by
Years
Formats
Representation types
Update frequencies
status
Resolution
-
This set of files includes downscaled projected estimates of monthly temperature (in degrees Celsius, no unit conversion necessary) from 2006-2300* at 15km x 15km spatial resolution. They include data for Alaska and Western Canada. Each set of files originates from one of five top ranked global circulation models from the CMIP5/AR5 models and RCPs, or is calculated as a 5 Model Average. *Some datasets from the five models used in modeling work by SNAP only have data going out to 2100. This metadata record serves to describe all of these models outputs for the full length of future time available. The downscaling process utilizes CRU CL v. 2.1 climatological datasets from 1961-1990 as the baseline for the Delta Downscaling method.
-
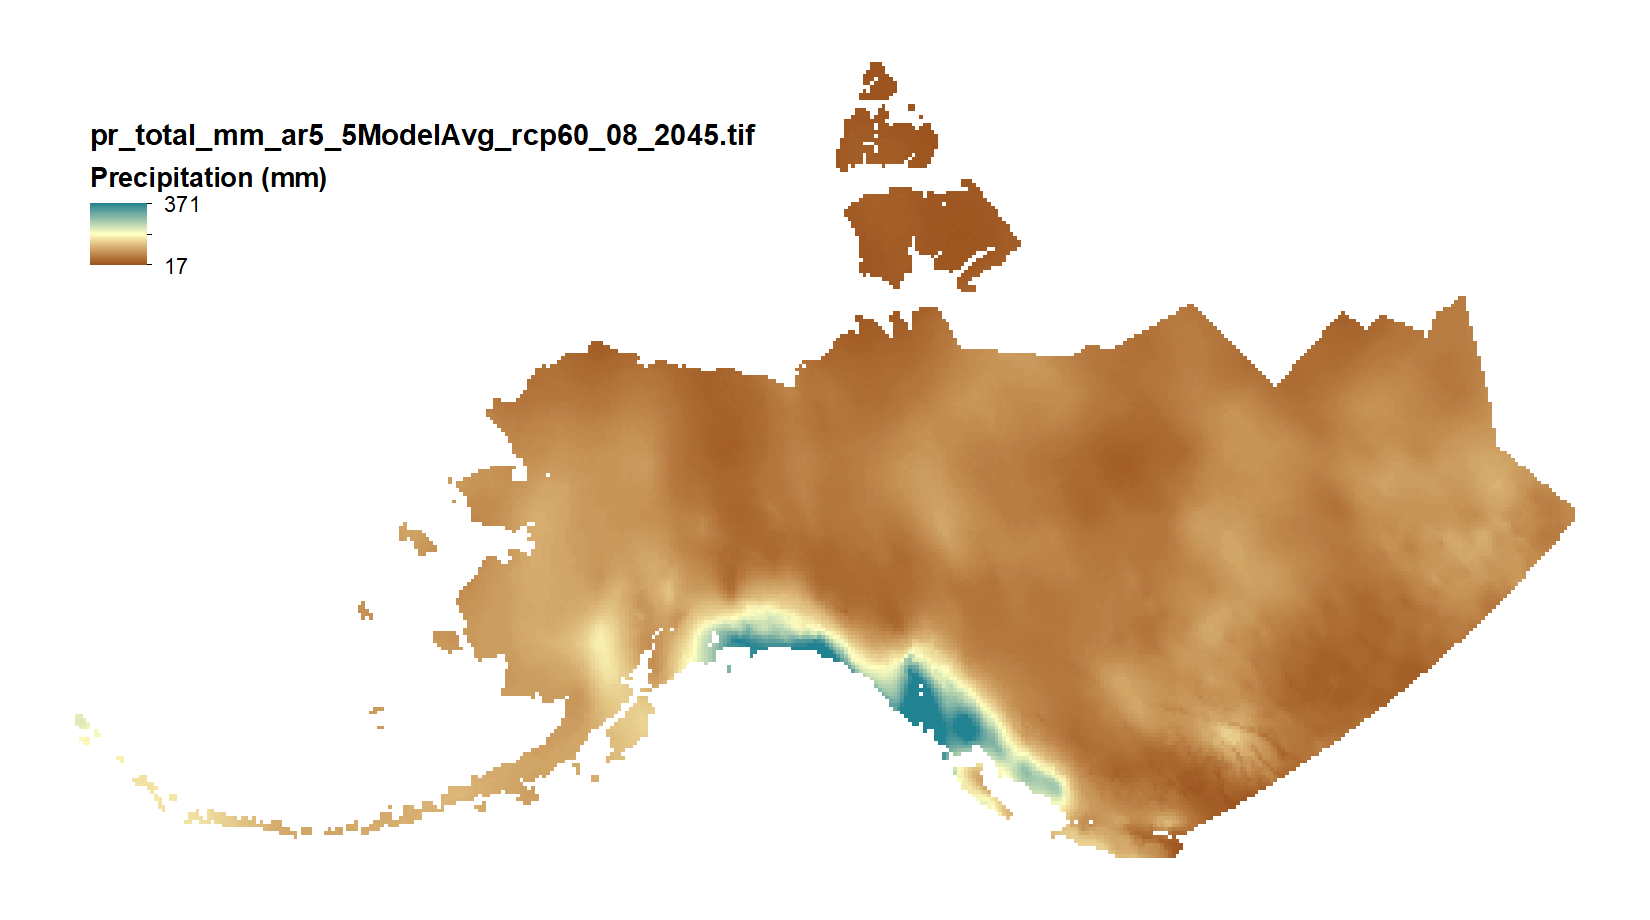
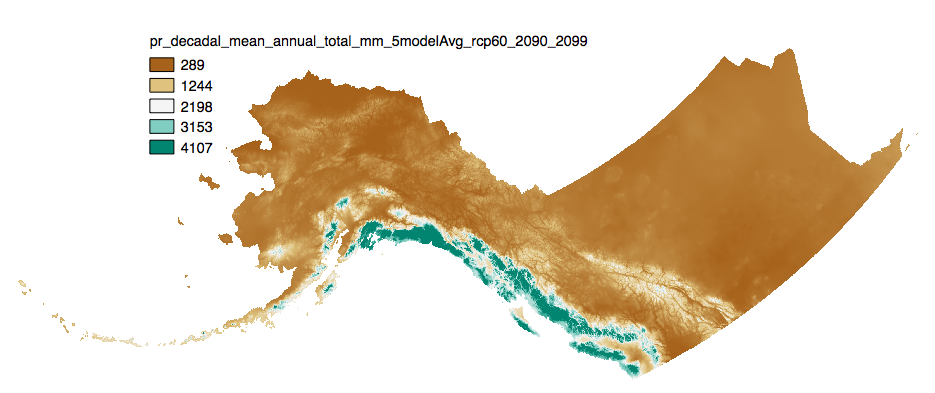
This set of files includes downscaled projections of monthly totals, and derived annual, seasonal, and decadal means of monthly total precipitation (in millimeters, no unit conversion necessary) from Jan 2006 - Dec 2100 at 771x771 meter spatial resolution. Each set of files originates from one of five top ranked global circulation models from the CMIP5/AR5 models and RPCs, or is calculated as a 5 Model Average. The downscaling process utilizes PRISM climatological datasets from 1971-2000. Brief descriptions of the datasets: Monthly precipitation totals: The total precipitation, in mm, for the month. For Decadal outputs: 1. Decadal Average Total Monthly Precipitation: 10 year average of total monthly precipitation. Example: All January precipitation files for a decade are added together and divided by ten. 2. Decadal Average Seasonal Precipitation Totals: 10 year average of seasonal precipitation totals. Example: MAM seasonal totals for every year in a decade are added together and divided by ten. 3. Decadal Average Annual Precipitation Totals: 10 year average of annual cumulative precipitation. For seasonal means, the four seasons are referred to by the first letter of 3 months making up that season: * `JJA`: summer (June, July, August) * `SON`: fall (September, October, November) * `DJF`: winter (December, January, February) * `MAM`: spring (March, April, May) Please note that these maps represent climatic estimates only. While we have based our work on scientifically accepted data and methods, uncertainty is always present. Uncertainty in model outputs tends to increase for more distant climatic estimates from present day for both historical summaries and future projections.
-
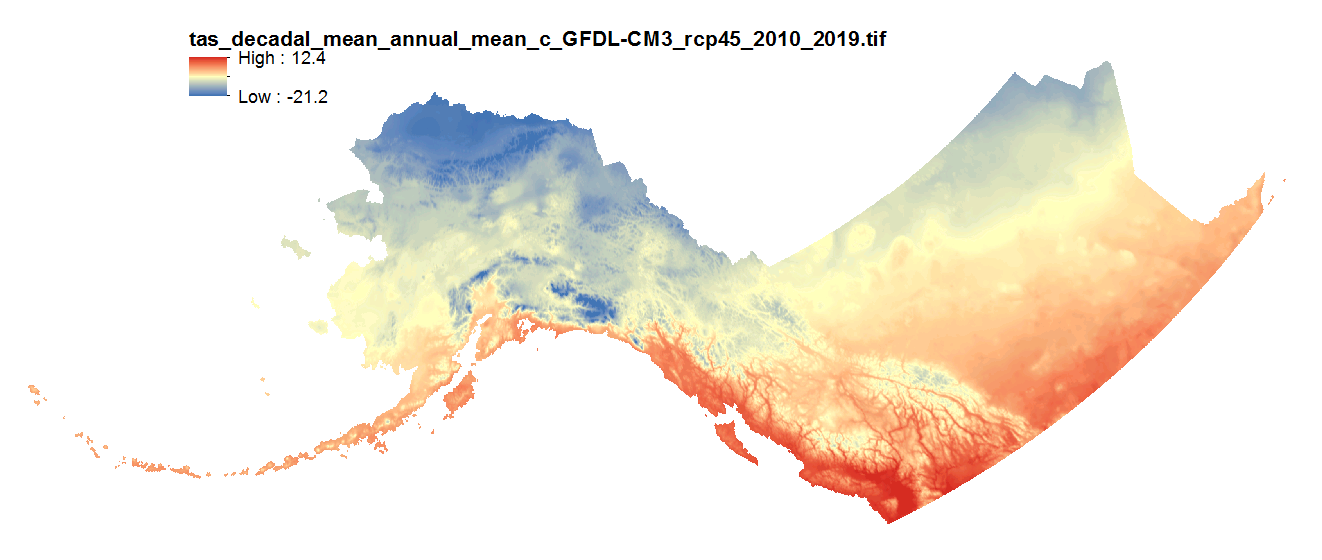
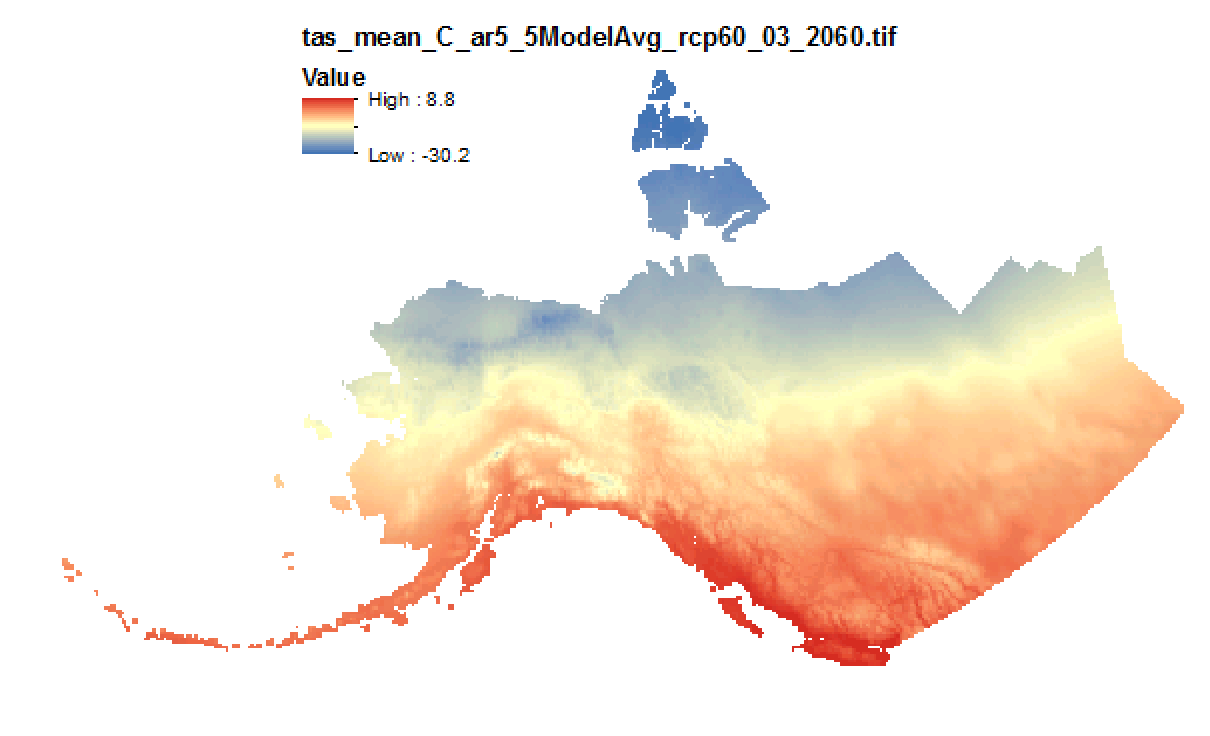
This set of files includes downscaled projections of monthly average, minimum, and maximum temperature and derived annual, seasonal, and decadal means of monthly average temperature (in degrees Celsius, no unit conversion necessary) from Jan 2006 - Dec 2100 at 2km x 2km spatial resolution across Alaska and parts of Canada. For seasonal means, the four seasons are referred to by the first letter of 3 months making up that season: * `JJA`: summer (June, July, August) * `SON`: fall (September, October, November) * `DJF`: winter (December, January, February) * `MAM`: spring (March, April, May) Each set of files originates from one of five top ranked global circulation models from the CMIP5/AR5 models and RPCs, or is calculated as a 5 Model Average. The downscaling process utilizes PRISM climatological datasets from 1961-1990. Please note that these maps represent climatic estimates only. While we have based our work on scientifically accepted data and methods, uncertainty is always present. Uncertainty in model outputs tends to increase for more distant climatic estimates from present day for both historical summaries and future projections.
-

This set of files includes downscaled projected estimates of monthly total precipitation (in mm, no unit conversion necessary) from 2006-2300 (or 2006-2100, as some datasets from the five models used in modeling work by SNAP only have data going out to 2100) at 15km x 15km spatial resolution. They include data for Alaska and Western Canada. Each set of files originates from one of five top ranked global circulation models from the CMIP5/AR5 models and RPCs, or is calculated as a 5 Model Average. The downscaling process utilizes CRU CL v. 2.1 climatological datasets from 1961-1990 as the baseline for the Delta Downscaling method. Please note that these maps represent climatic estimates only. While we have based our work on scientifically accepted data and methods, uncertainty is always present. Uncertainty in model outputs tends to increase for more distant climatic estimates from present day for both historical summaries and future projections.
-
This set of files includes downscaled projections of monthly totals, and derived annual, seasonal, and decadal means of monthly total precipitation (in millimeters, no unit conversion necessary) from Jan 2006 - Dec 2100 at 2km x 2km spatial resolution. Each set of files originates from one of five top ranked global circulation models from the CMIP5/AR5 models and RPCs, or is calculated as a 5 Model Average. The downscaling process utilizes PRISM climatological datasets from 1961-1990. **Brief descriptions of the datasets:** Monthly precipitation totals: The total precipitation, in mm, for the month. For Decadal outputs: 1. Decadal Average Total Monthly Precipitation: 10 year average of total monthly precipitation. Example: All January precipitation files for a decade are added together and divided by ten. 2. Decadal Average Seasonal Precipitation Totals: 10 year average of seasonal precipitation totals. Example: MAM seasonal totals for every year in a decade are added together and divided by ten. 3. Decadal Average Annual Precipitation Totals: 10 year average of annual cumulative precipitation. For seasonal means, the four seasons are referred to by the first letter of 3 months making up that season: * `JJA`: summer (June, July, August) * `SON`: fall (September, October, November) * `DJF`: winter (December, January, February) * `MAM`: spring (March, April, May) Please note that these maps represent climatic estimates only. While we have based our work on scientifically accepted data and methods, uncertainty is always present. Uncertainty in model outputs tends to increase for more distant climatic estimates from present day for both historical summaries and future projections.
-

This dataset consists of 6000 GeoTIFFs produced by the Geophysical Institute Permafrost Lab (GIPL) Permafrost Model. Six distinct CMIP5 model-scenario combinations were used to force the GIPL model output. Each model-scenario combination includes annual (2021-2120) summaries of the following ten variables: - Mean Annual Ground Temperature (MAGT) at 0.5 m below the surface (°C) - MAGT at 1 m below the surface (°C) - MAGT at 2 m below the surface (°C) - MAGT at 3 m below the surface (°C) - MAGT at 4 m below the surface (°C) - MAGT at 5 m below the surface (°C) - Mean Annual Surface (i.e., 0.01 m depth) Temperature (°C) - Permafrost top (upper boundary of the permafrost, depth below the surface in m) - Permafrost base (lower boundary of the permafrost, depth below the surface in m) - Talik thickness (perennially unfrozen ground occurring in permafrost terrain, m) There are 1000 GeoTIFF files per model-scenario combination. The model-scenario combinations are: - GFDL-CM3, RCP 4.5 - GFDL-CM3, RCP 8.5 - NCAR-CCSM4, RCP 4.5 - NCAR-CCSM4, RCP 8.5 - A 5-Model (GFDL-CM3, NCAR-CCSM4, GISS-E2-R, IPSL-CM5A-LR, MRI-CGCM3) Average, RCP 8.5 - A 5-Model (GFDL-CM3, NCAR-CCSM4, GISS-E2-R, IPSL-CM5A-LR, MRI-CGCM3) Average, RCP 4.5 The file naming convention is `gipl_model_scenario_variable_year.tif` for example: `gipl_GFDL-CM3_rcp45_talikthickness_m_2090.tif` Each GeoTIFF uses the Alaska Albers (EPSG:3338) projection and has a spatial resolution of 1 km x 1 km. All rasters in this dataset have indentical extents, spatial references, and metadata objects. Once extracted, the entire dataset (all 6000 GeoTIFFs) requires 39 GB of disk space. Data are compressed into ten .zip files, one per variable. Each archive will contain all model-scenario combinations and all years for that variable. Each .zip file contains 600 GeoTIFFs. This research was funded by the Broad Agency Announcement Program and the U.S. Army Engineer Research and Development Center and Cold Regions Research and Engineering Laboratory (ERDC-CRREL) under Contract No. W913E521C0010. The GIPL2-MPI/GCM simulations were supported in part by the high-performance computing and data storage resources operated by the Research Computing Systems Group at the University of Alaska Fairbanks Geophysical Institute.
-

This dataset includes 42,120 GeoTIFFs (spatial resolution: 12 km) that represent decadal (15 decades between 1950-2099) means of monthly summaries of the following variables (units, abbreviations and case match those used in the source daily resolution dataset). There are three distinct groups of variables: Meteorological, Water State, and Water Flux. Meteorological Variables - tmax (Maximum daily 2-m air temperature, °C) - tmin (Minimum daily 2-m air temperature, °C) - pcp (Daily precipitation, mm per day) Water State Variables - SWE (Snow water equivalent, mm) - IWE (Ice water equivalent, mm) - SM1 (Soil moisture layer 1: surface to 0.02 m depth, mm) - SM2 (Soil moisture layer 2: 0.02 m to 0.97 m depth, mm) - SM3 (Soil moisture layer 3: 0.97 m to 3.0 m depth, mm) Water Flux Variables - RUNOFF (Surface runoff, mm per day) - EVAP (Actual evapotranspiration, mm per day) - SNOW_MELT (Snow melt, mm per day) - GLACIER_MELT (Ice melt, mm per day) Monthly summary functions, or how the daily frequency source data are condensed into a single monthly value, are as follows: - Sum: pcp, SNOW_MELT, EVAP, GLACIER_MELT, RUNOFF - Mean: tmin, tmax, SM1, SM2, SM3 - Maximum: IWE, SWE The model-scenario combinations used to represent various plausible climate futures are: - ACCESS1-3, RCP 4.5 - ACCESS1-3, RCP 8.5 - CanESM2, RCP 4.5 - CanESM2, RCP 8.5 - CCSM4, RCP 4.5 - CCSM4, RCP 8.5 - CSIRO-Mk3-6-0, RCP 4.5 - CSIRO-Mk3-6-0, RCP 8.5 - GFDL-ESM2M, RCP 4.5 - GFDL-ESM2M, RCP 8.5 - HadGEM2-ES, RCP 4.5 - HadGEM2-ES, RCP 8.5 - inmcm4, RCP 4.5 - inmcm4, RCP 8.5 - MIROC5, RCP 4.5 - MIROC5, RCP 8.5 - MPI-ESM-MR, RCP 4.5 - MPI-ESM-MR, RCP 8.5 - MRI-CGCM3, RCP 4.5 - MRI-CGCM3, RCP 8.5 The .zip files that are available for download are organized by variable. One .zip file has all the models and scenarios and decades and months for that variable. Each GeoTIFF file has a naming convention like this: {climate variable}_{units}_{model}_{scenario}_{month abbreviation}_{summary function}_{decade start}-{decade end}_mean.tif Each GeoTIFF has a 12 km by 12 km pixel size, and is projected to EPSG:3338 (Alaska Albers).
-

This dataset consists of four different variables: degree days below 65°F (or "heating degree days"), degree days below 0°F, degree days below 32°F (or "air freezing index"), and degree days above 32°F (or "air thawing index"). All were derived from the same set of nine statistically downscaled CMIP5 global climate model outputs driven by RCP 4.5 and RCP 8.5 emissions scenarios. A historical baseline (Daymet, 1980-2017) dataset is included for each variable. All data are in GeoTIFF format and have a spatial resolution of 12 km. Units are degree days Fahrenheit (°F⋅days). The model-scenario combinations are: - ACCESS1-3, RCP 4.5 - ACCESS1-3, RCP 8.5 - CanESM2, RCP 4.5 - CanESM2, RCP 8.5 - CCSM4, RCP 4.5 - CCSM4, RCP 8.5 - CSIRO-Mk3-6-0, RCP 4.5 - CSIRO-Mk3-6-0, RCP 8.5 - GFDL-ESM2M, RCP 4.5 - GFDL-ESM2M, RCP 8.5 - inmcm4, RCP 4.5 - inmcm4, RCP 8.5 - MIROC5, RCP 4.5 - MIROC5, RCP 8.5 - MPI-ESM-MR, RCP 4.5 - MPI-ESM-MR, RCP 8.5 - MRI-CGCM3, RCP 4.5 - MRI-CGCM3, RCP 8.5 The .zip files that are available for download are organized by variable. One .zip file has all the models and scenarios and years for that variable. Each GeoTIFF file has a naming convention like this: "ncar_12km_{model}_{scenario}_{variable}_{year}_Fdays.tif" Each GeoTIFF has a 12 km by 12 km pixel size, and is projected to EPSG:3338 (Alaska Albers).
-
This dataset contains historical and projected dynamically downscaled climate data for the State of Alaska and surrounding regions at 20km spatial resolution and hourly temporal resolution. Select variables are also summarized into daily resolutions. This data was produced using the Weather Research and Forecasting (WRF) model (Version 3.5). We downscaled both ERA-Interim historical reanalysis data (1979 - Oct 2015) and both historical and projected runs from 2 GCM’s from the Coupled Model Inter-comparison Project 5 (CMIP5): GFDL-CM3 and NCAR-CCSM4 (historical run: 1970-2005 and RCP 8.5: 2006-2100). This dataset was updated to a version 1.1 in August, 2023 to retain useful fields of latitude and longitude geolocation grids from the WRF model. The original version is available upon request.
-
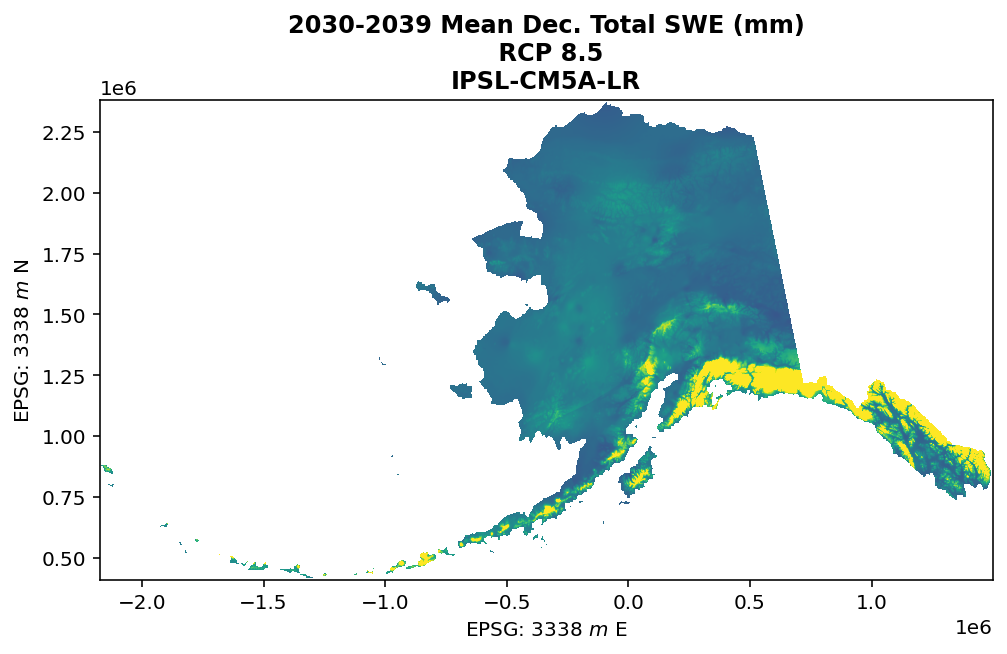
These files include downscaled projections of decadal average monthly snowfall (water) equivalent (SWE) in millimeters for each month of the decades from 2010-2019 to 2090-2099 at 771 x 771 m spatial resolution. Each file represents a decadal average monthly mean. Output is available for the NCAR-CCSM4, GFDL-CM3, GISS-E2-R, IPSL-CM5A-LR, and MRI-CGCM3 models and three emissions scenarios (RCP 4.5, RCP 6.0 and RCP 8.5). SWE estimates were produced by multiplying snow-day fraction ("fs") by decadal average monthly precipitation ("Pr") such that SWE = (fs * Pr) / 100