 SNAP GeoNetwork
precipitation
Type of resources
Topics
Keywords
Contact for the resource
Provided by
Years
Formats
Representation types
Update frequencies
status
Resolution
-
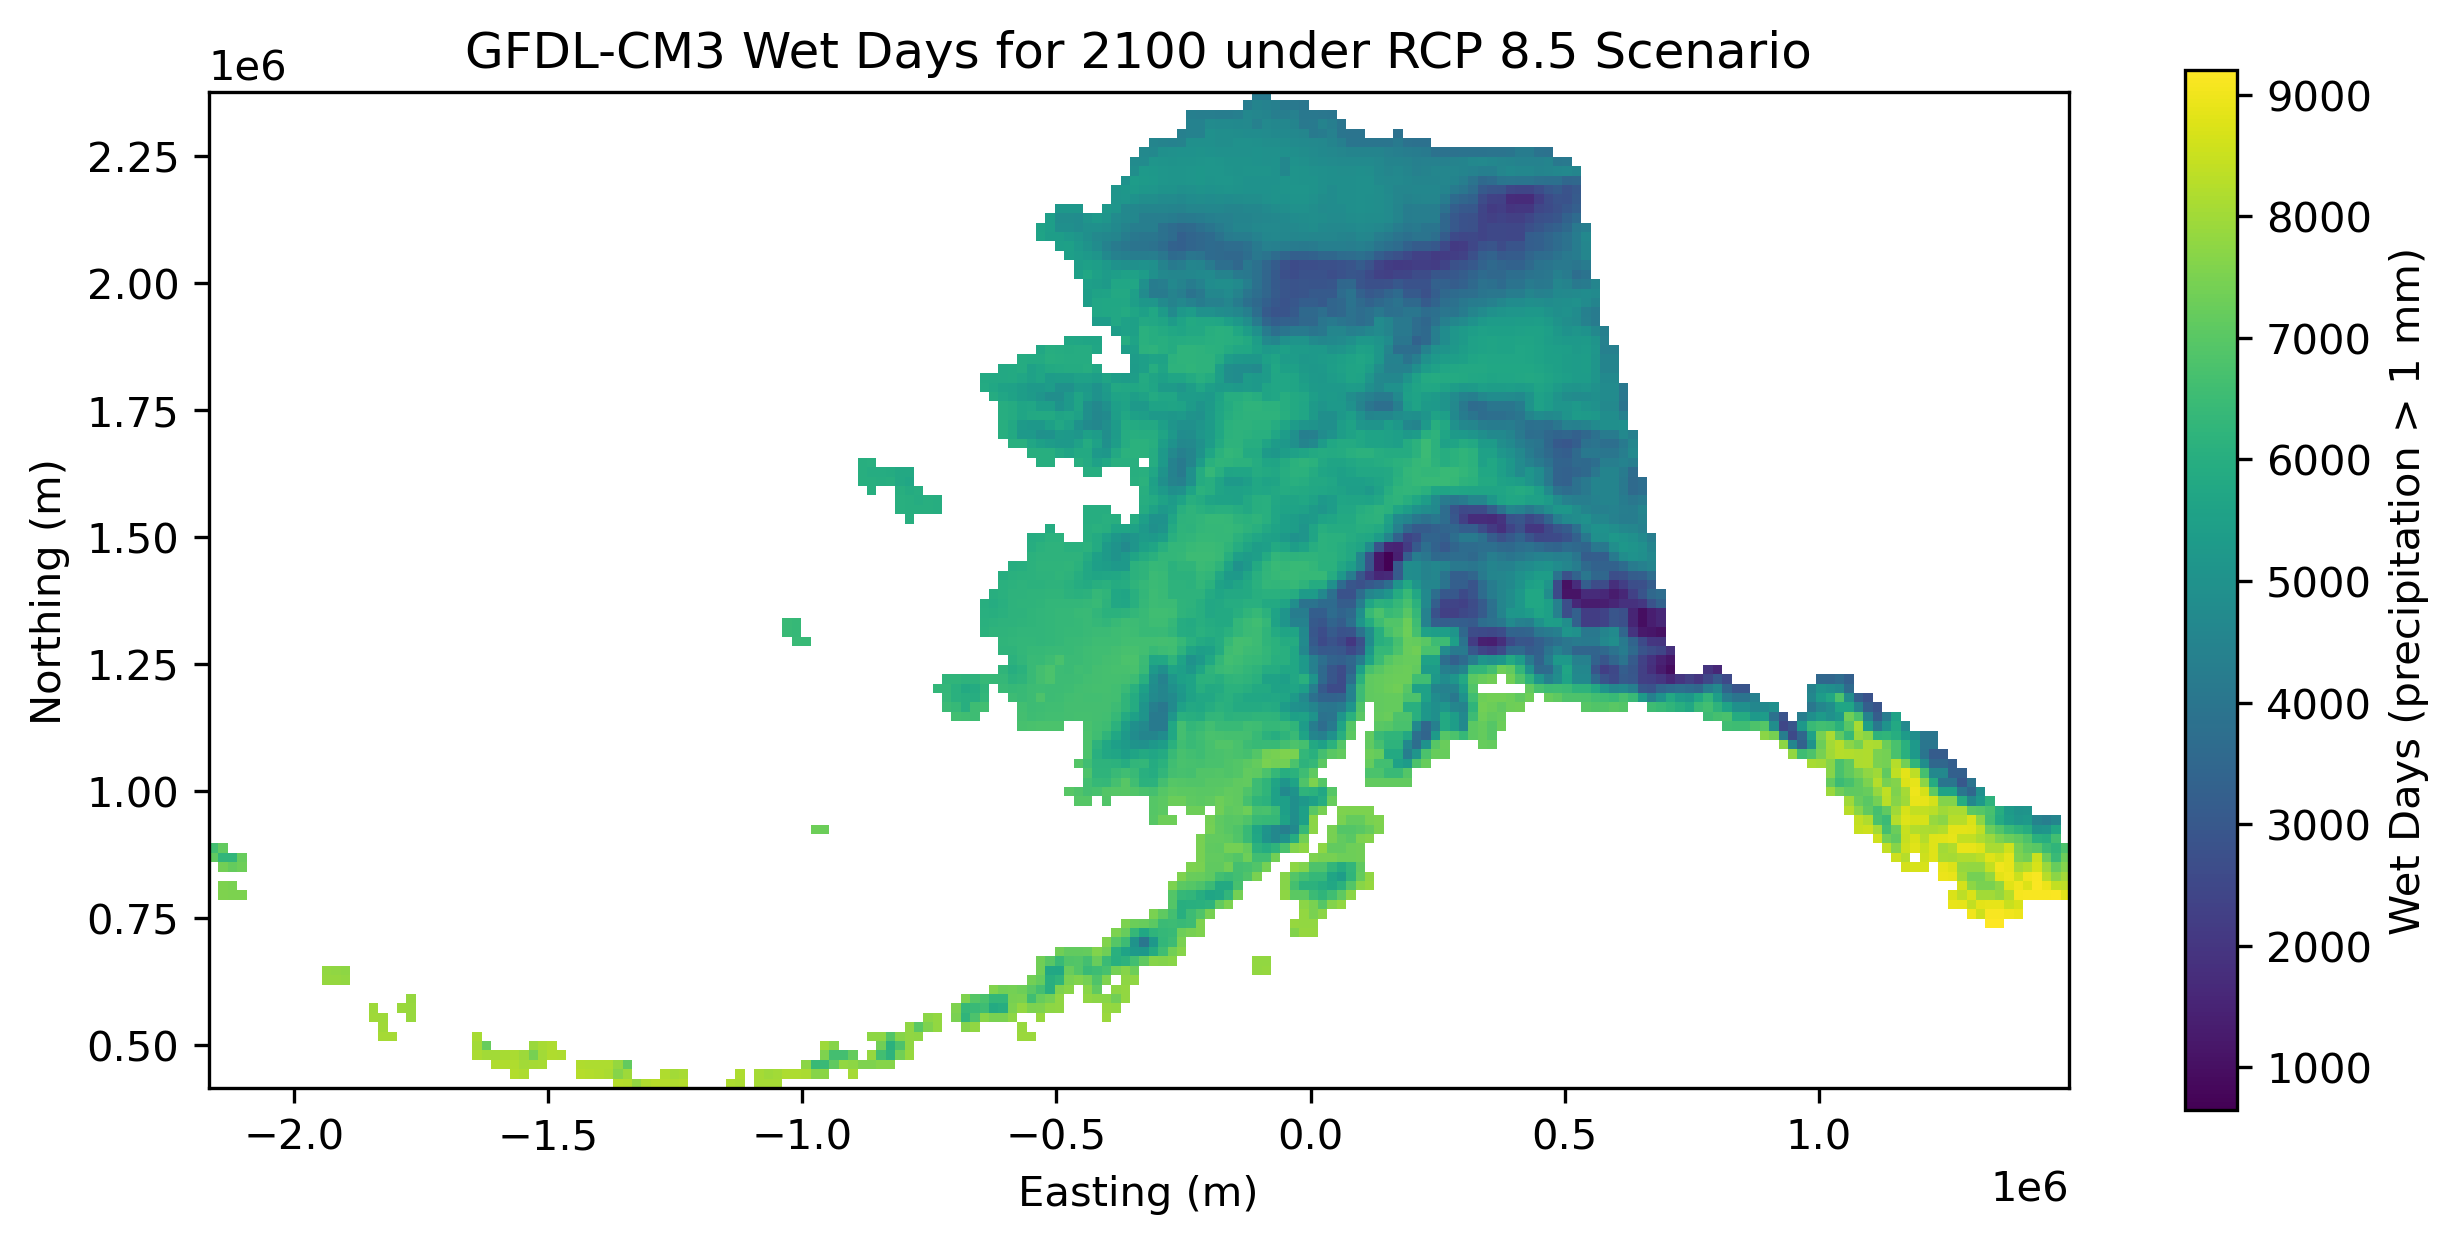
This dataset consists of single band GeoTIFFs containing total annual counts of wet days for each year from 1980-2100 for one downscaled reanalysis (ERA-Interim, 1980-2015) and two downscaled CMIP5 global climate models driven under the RCP 8.5 baseline emissions scenario (NCAR-CCSM4 and GFDL-CM3, 2006-2100), all derived from the same dynamical downscaling effort using the Weather Research and Forecasting (WRF) model (Version 3.5). A day is counted as a "wet day" if the total precipitation for that day is 1 mm or greater.
-
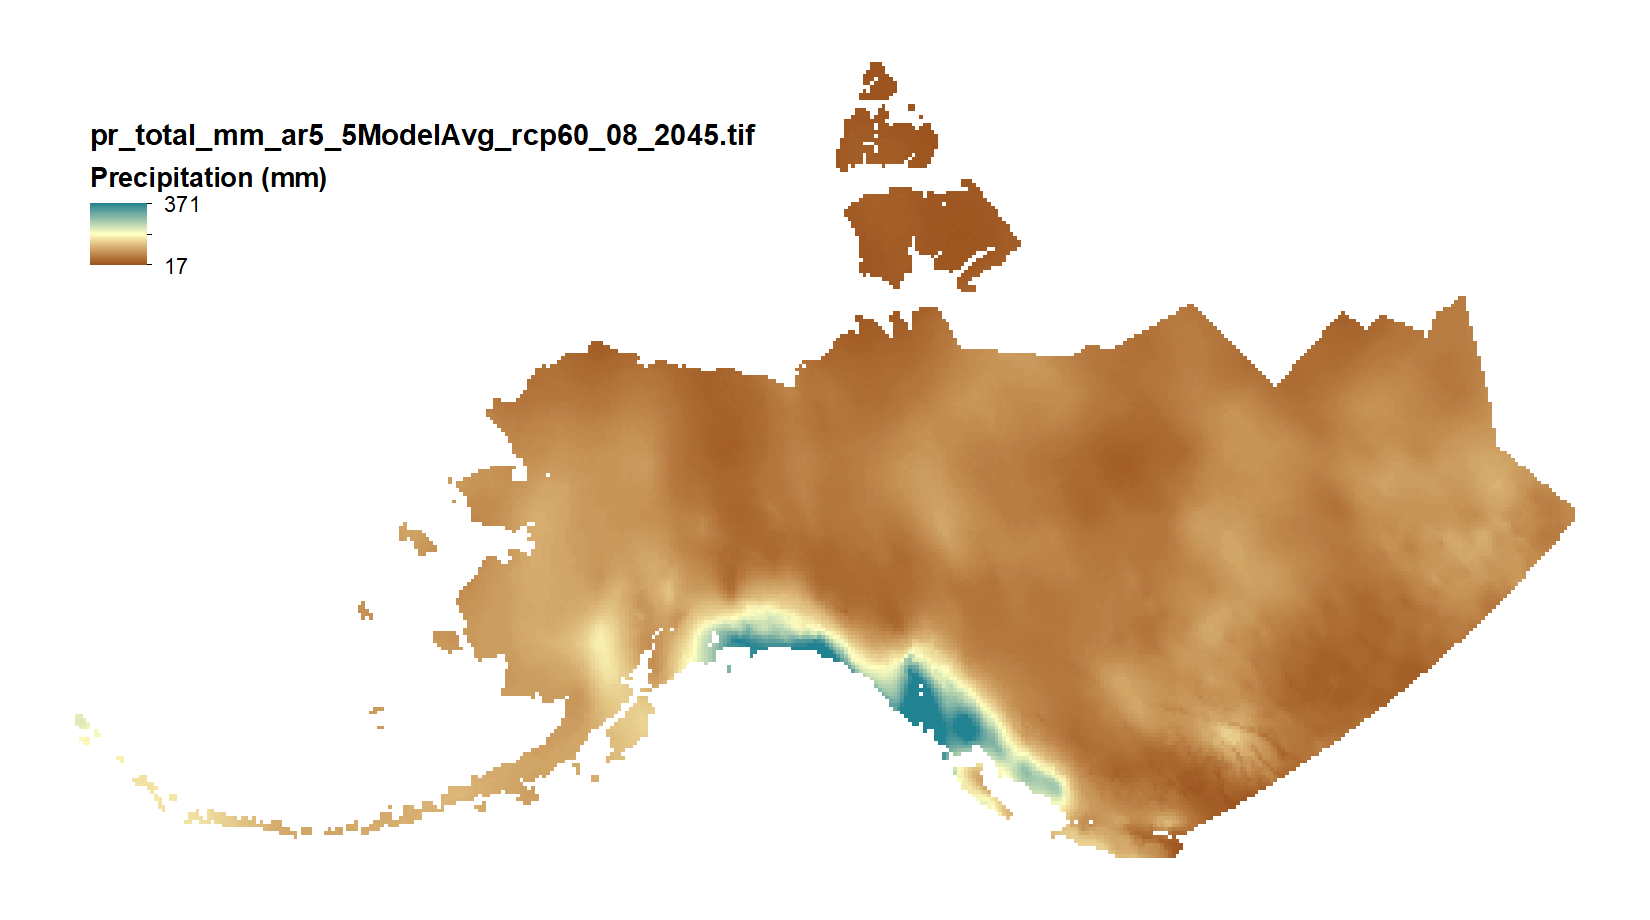
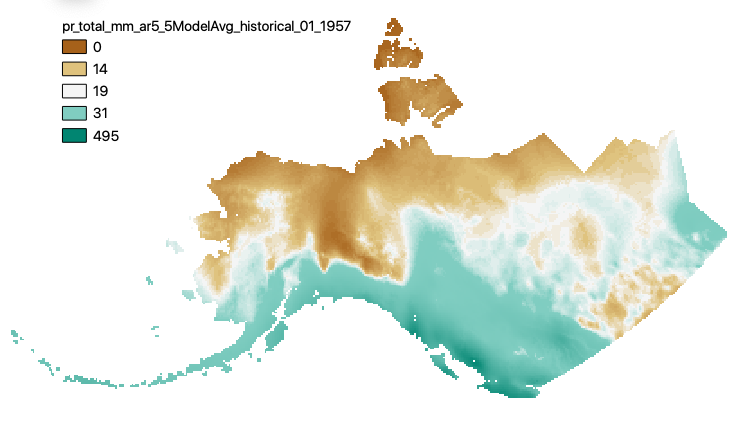
This set of files includes downscaled projections of monthly totals, and derived annual, seasonal, and decadal means of monthly total precipitation (in millimeters, no unit conversion necessary) from Jan 2006 - Dec 2100 at 771x771 meter spatial resolution. Each set of files originates from one of five top ranked global circulation models from the CMIP5/AR5 models and RPCs, or is calculated as a 5 Model Average. The downscaling process utilizes PRISM climatological datasets from 1971-2000. Brief descriptions of the datasets: Monthly precipitation totals: The total precipitation, in mm, for the month. For Decadal outputs: 1. Decadal Average Total Monthly Precipitation: 10 year average of total monthly precipitation. Example: All January precipitation files for a decade are added together and divided by ten. 2. Decadal Average Seasonal Precipitation Totals: 10 year average of seasonal precipitation totals. Example: MAM seasonal totals for every year in a decade are added together and divided by ten. 3. Decadal Average Annual Precipitation Totals: 10 year average of annual cumulative precipitation. For seasonal means, the four seasons are referred to by the first letter of 3 months making up that season: * `JJA`: summer (June, July, August) * `SON`: fall (September, October, November) * `DJF`: winter (December, January, February) * `MAM`: spring (March, April, May) Please note that these maps represent climatic estimates only. While we have based our work on scientifically accepted data and methods, uncertainty is always present. Uncertainty in model outputs tends to increase for more distant climatic estimates from present day for both historical summaries and future projections.
-

This set of files includes downscaled historical estimates of monthly total precipitation (in millimeters) at 1 kilometer spatial resolution. Each file represents a single month in a given year. The original SNAP downscaled precipitation product at 2 kilometer spatial resolution was resampled to 1 kilometer spatial resolution via bilinear interpolation to create these data for input to the Integrated Ecosystem Model (IEM). Please note that this data is used to fill in a gap in available data for the IEM and does not constitute a complete or precise measurement of this variable in all locations.
-

These files include downscaled historical decadal average monthly snowfall equivalent ("SWE", in millimeters) for each month at 771 x 771 m spatial resolution. Each file represents a decadal average monthly mean. Historical data for 1910-1919 to 1990-1999 are available for CRU TS3.0-based data and for 1910-1919 to 2000-2009 for CRU TS3.1-based data.
-
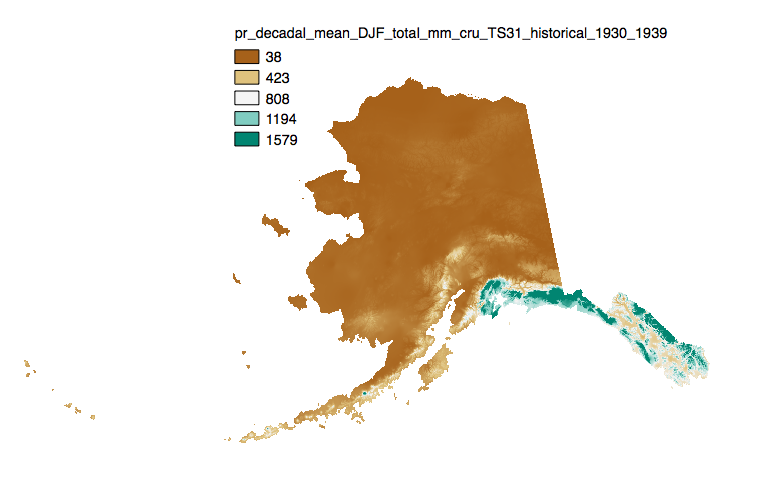
This set of files includes downscaled historical estimates of monthly totals, and derived annual, seasonal, and decadal means of monthly total precipitation (in millimeters, no unit conversion necessary) from 1901 - 2006 (CRU TS 3.0) or 2009 (CRU TS 3.1) at 771 x 771 meter spatial resolution.
-
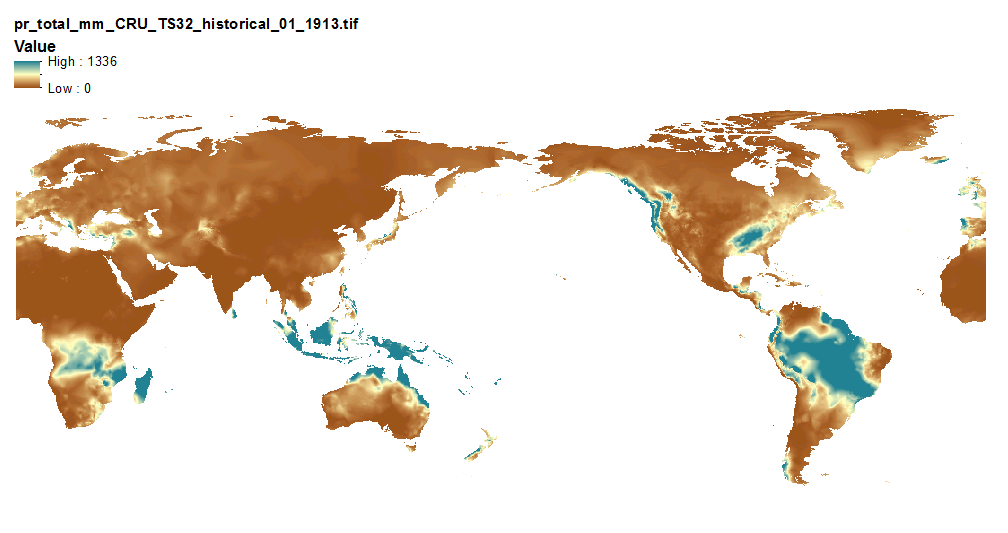
This set of files includes downscaled historical estimates of monthly total precipitation (in millimeters, no unit conversion necessary, rainwater equivalent) from 1901 - 2013 (CRU TS 3.22) at 10 min x 10 min spatial resolution with global coverage. The downscaling process utilizes CRU CL v. 2.1 climatological datasets from 1961-1990.
-
This set of files includes downscaled historical estimates of monthly total precipitation (in mm, no unit conversion necessary) from 1901 - 2005, at 15km x 15km spatial resolution. They include data for Alaska and Western Canada. Each set of files originates from one of five top ranked global circulation models from the CMIP5/AR5 models and RCPs, or is calculated as a 5 Model Average. These outputs are from the Historical runs of the GCMs. The downscaling process utilizes CRU CL v. 2.1 climatological datasets from 1961-1990 as the baseline for the Delta Downscaling method.
-
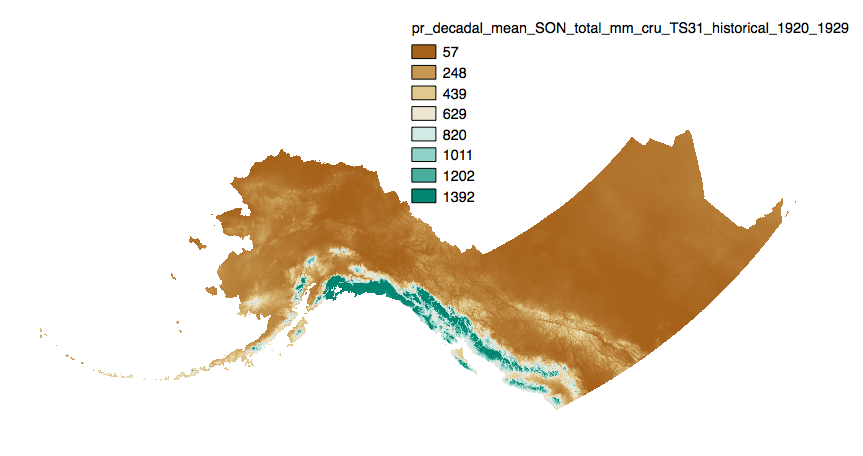
This dataset includes downscaled historical estimates of monthly average, minimum, and maximum precipitation and derived annual, seasonal, and decadal means of monthly total precipitation (in millimeters, no unit conversion necessary) from 1901 to 2006 (CRU TS 3.0), 2009 (CRU TS 3.1), 2015 (CRU TS 4.0), 2020 (CRU TS 4.05), or 2023 (CRU TS 4.08) at 2km x 2km spatial resolution. CRU TS 4.0 is only available as monthly averages, minimum, and maximum files. CRU TS 4.05 and 4.08 data are only available as monthly averages. The downscaling process utilizes PRISM climatological datasets from 1961-1990.
-

This set of files includes downscaled projected estimates of monthly total precipitation (in mm, no unit conversion necessary) from 2006-2300 (or 2006-2100, as some datasets from the five models used in modeling work by SNAP only have data going out to 2100) at 15km x 15km spatial resolution. They include data for Alaska and Western Canada. Each set of files originates from one of five top ranked global circulation models from the CMIP5/AR5 models and RPCs, or is calculated as a 5 Model Average. The downscaling process utilizes CRU CL v. 2.1 climatological datasets from 1961-1990 as the baseline for the Delta Downscaling method. Please note that these maps represent climatic estimates only. While we have based our work on scientifically accepted data and methods, uncertainty is always present. Uncertainty in model outputs tends to increase for more distant climatic estimates from present day for both historical summaries and future projections.
-
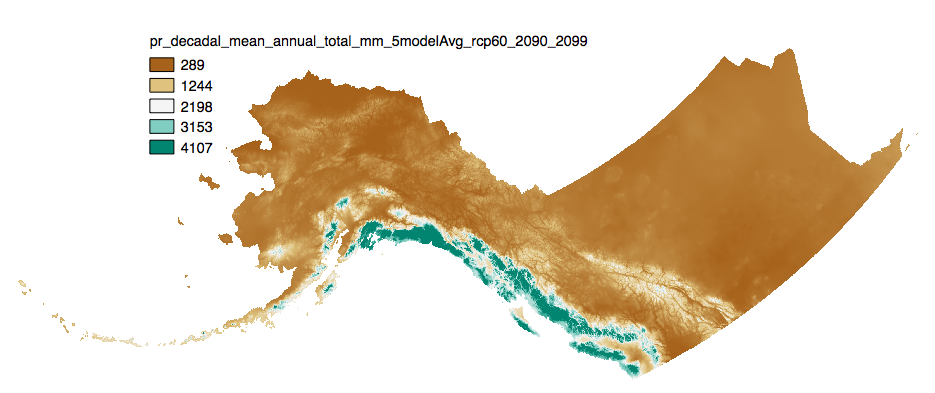
This set of files includes downscaled projections of monthly totals, and derived annual, seasonal, and decadal means of monthly total precipitation (in millimeters, no unit conversion necessary) from Jan 2006 - Dec 2100 at 2km x 2km spatial resolution. Each set of files originates from one of five top ranked global circulation models from the CMIP5/AR5 models and RPCs, or is calculated as a 5 Model Average. The downscaling process utilizes PRISM climatological datasets from 1961-1990. **Brief descriptions of the datasets:** Monthly precipitation totals: The total precipitation, in mm, for the month. For Decadal outputs: 1. Decadal Average Total Monthly Precipitation: 10 year average of total monthly precipitation. Example: All January precipitation files for a decade are added together and divided by ten. 2. Decadal Average Seasonal Precipitation Totals: 10 year average of seasonal precipitation totals. Example: MAM seasonal totals for every year in a decade are added together and divided by ten. 3. Decadal Average Annual Precipitation Totals: 10 year average of annual cumulative precipitation. For seasonal means, the four seasons are referred to by the first letter of 3 months making up that season: * `JJA`: summer (June, July, August) * `SON`: fall (September, October, November) * `DJF`: winter (December, January, February) * `MAM`: spring (March, April, May) Please note that these maps represent climatic estimates only. While we have based our work on scientifically accepted data and methods, uncertainty is always present. Uncertainty in model outputs tends to increase for more distant climatic estimates from present day for both historical summaries and future projections.