 SNAP GeoNetwork
projected
Type of resources
Topics
Keywords
Contact for the resource
Provided by
Years
Formats
Representation types
Update frequencies
status
Scale
Resolution
-
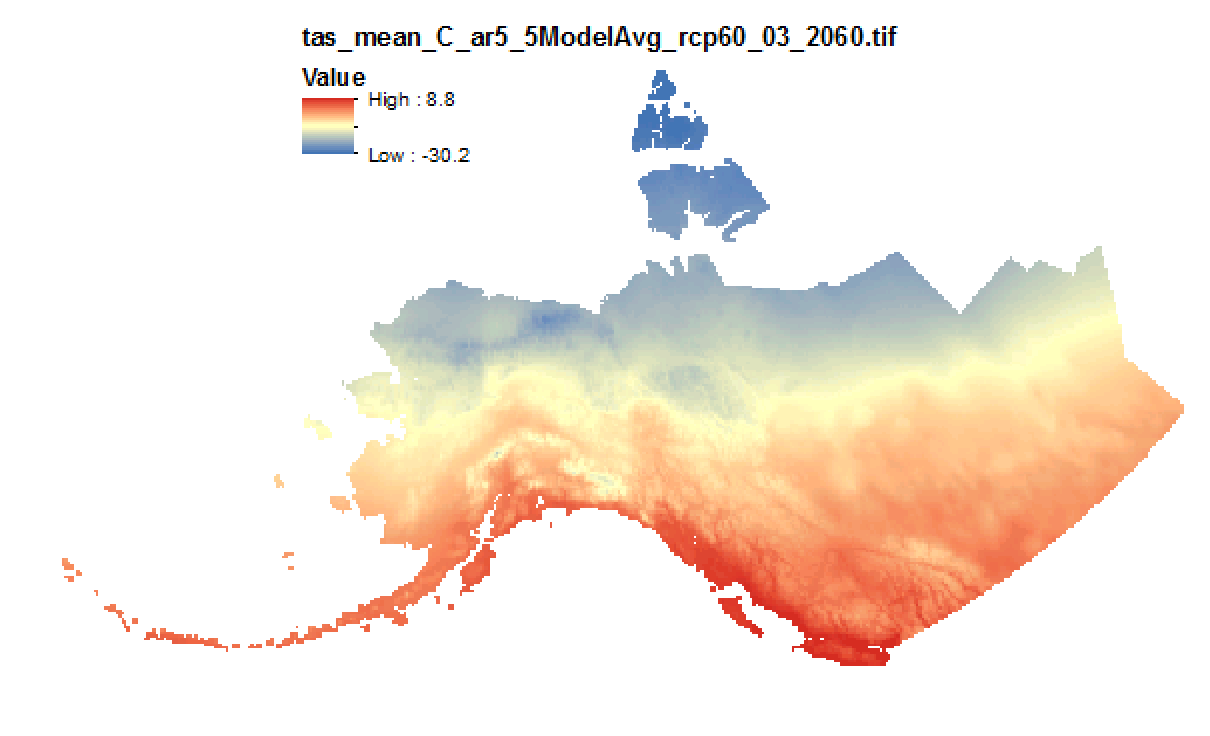
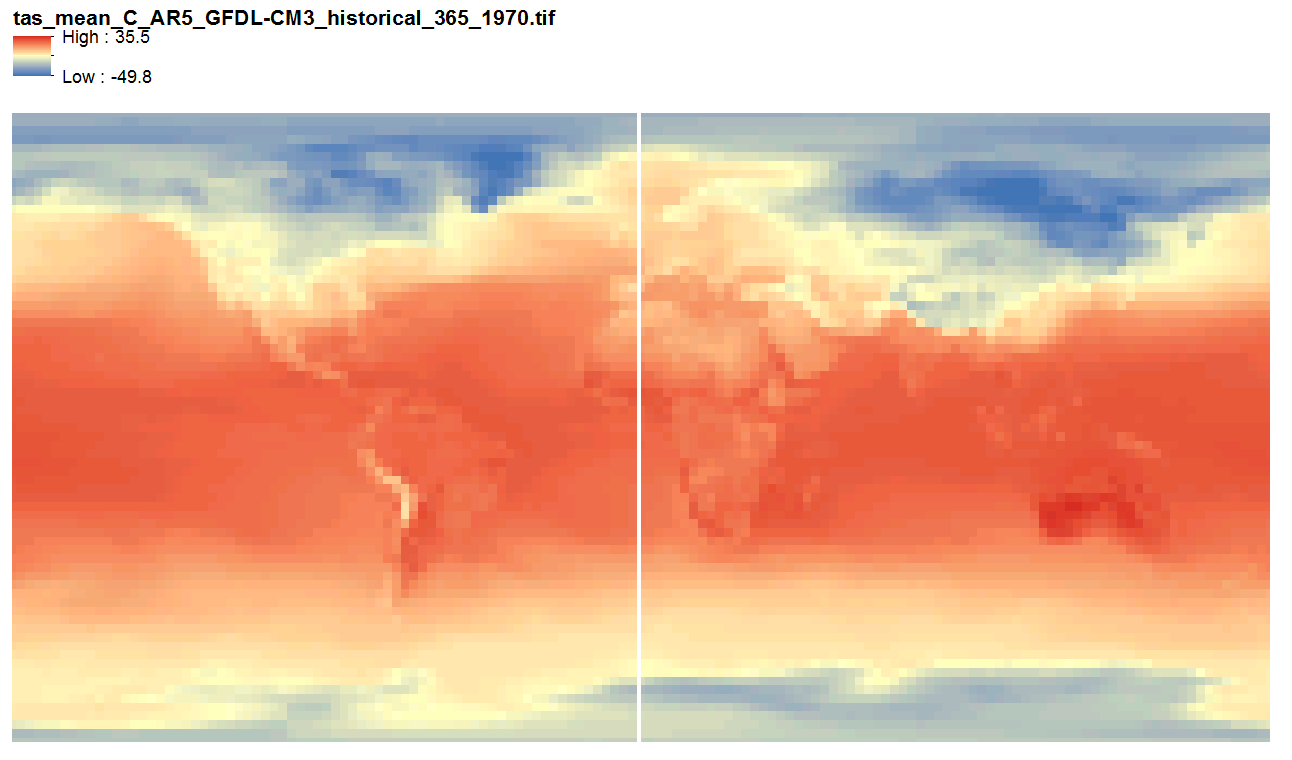
This set of files includes downscaled projected estimates of monthly temperature (in degrees Celsius, no unit conversion necessary) from 2006-2300* at 15km x 15km spatial resolution. They include data for Alaska and Western Canada. Each set of files originates from one of five top ranked global circulation models from the CMIP5/AR5 models and RCPs, or is calculated as a 5 Model Average. *Some datasets from the five models used in modeling work by SNAP only have data going out to 2100. This metadata record serves to describe all of these models outputs for the full length of future time available. The downscaling process utilizes CRU CL v. 2.1 climatological datasets from 1961-1990 as the baseline for the Delta Downscaling method.
-
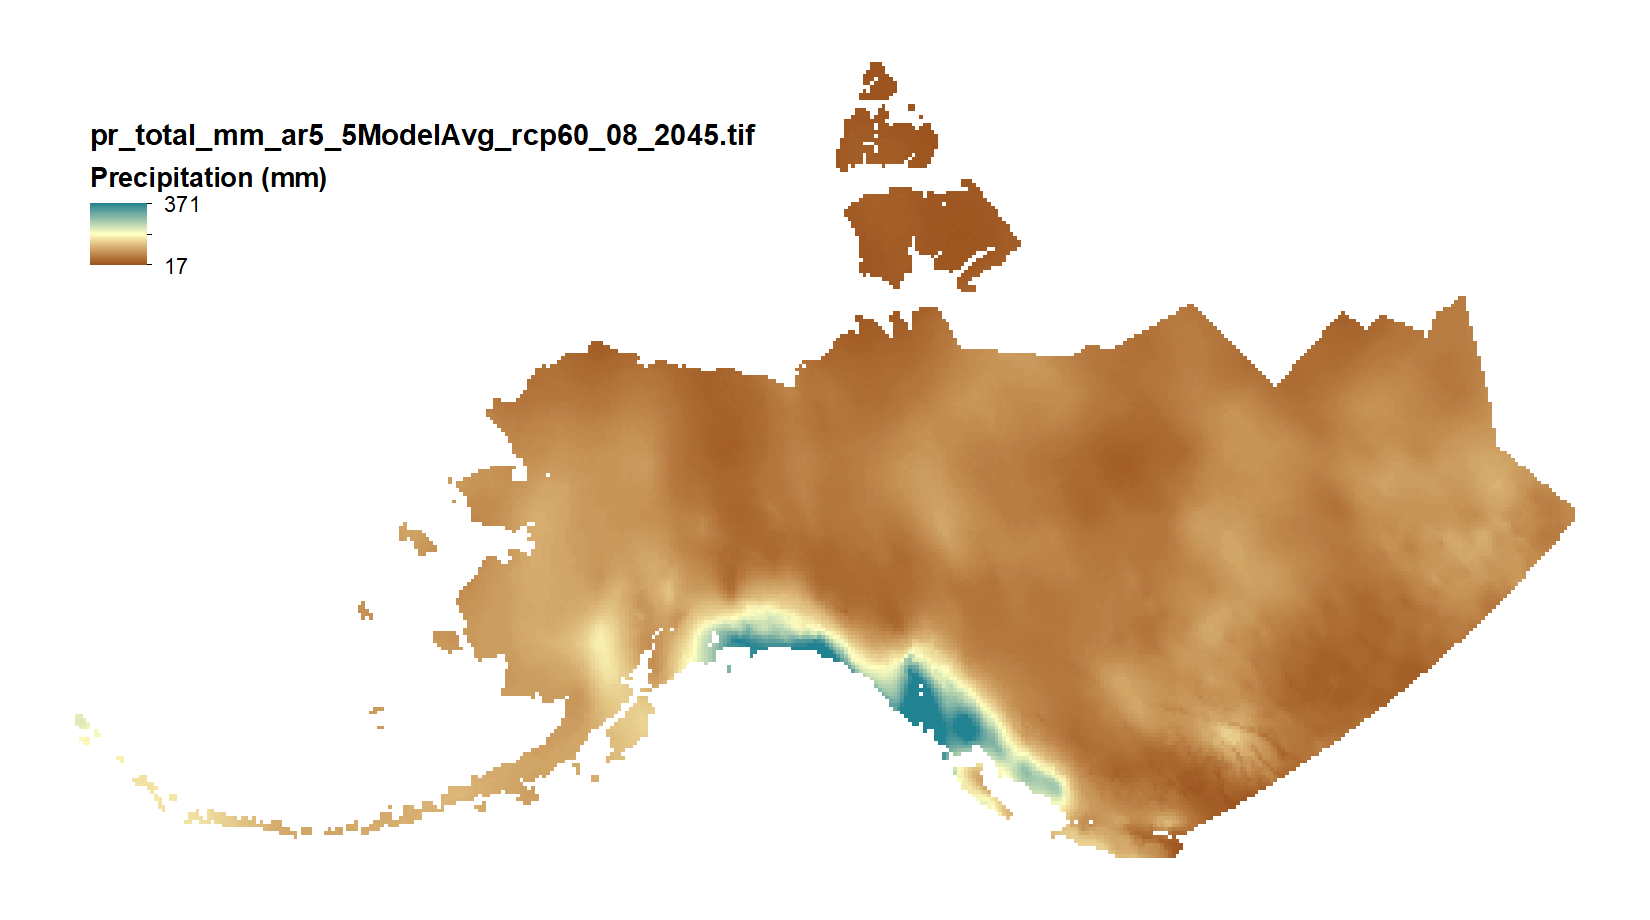
This set of files includes downscaled projections of monthly totals, and derived annual, seasonal, and decadal means of monthly total precipitation (in millimeters, no unit conversion necessary) from Jan 2006 - Dec 2100 at 771x771 meter spatial resolution. Each set of files originates from one of five top ranked global circulation models from the CMIP5/AR5 models and RPCs, or is calculated as a 5 Model Average. The downscaling process utilizes PRISM climatological datasets from 1971-2000. Brief descriptions of the datasets: Monthly precipitation totals: The total precipitation, in mm, for the month. For Decadal outputs: 1. Decadal Average Total Monthly Precipitation: 10 year average of total monthly precipitation. Example: All January precipitation files for a decade are added together and divided by ten. 2. Decadal Average Seasonal Precipitation Totals: 10 year average of seasonal precipitation totals. Example: MAM seasonal totals for every year in a decade are added together and divided by ten. 3. Decadal Average Annual Precipitation Totals: 10 year average of annual cumulative precipitation. For seasonal means, the four seasons are referred to by the first letter of 3 months making up that season: * `JJA`: summer (June, July, August) * `SON`: fall (September, October, November) * `DJF`: winter (December, January, February) * `MAM`: spring (March, April, May) Please note that these maps represent climatic estimates only. While we have based our work on scientifically accepted data and methods, uncertainty is always present. Uncertainty in model outputs tends to increase for more distant climatic estimates from present day for both historical summaries and future projections.
-
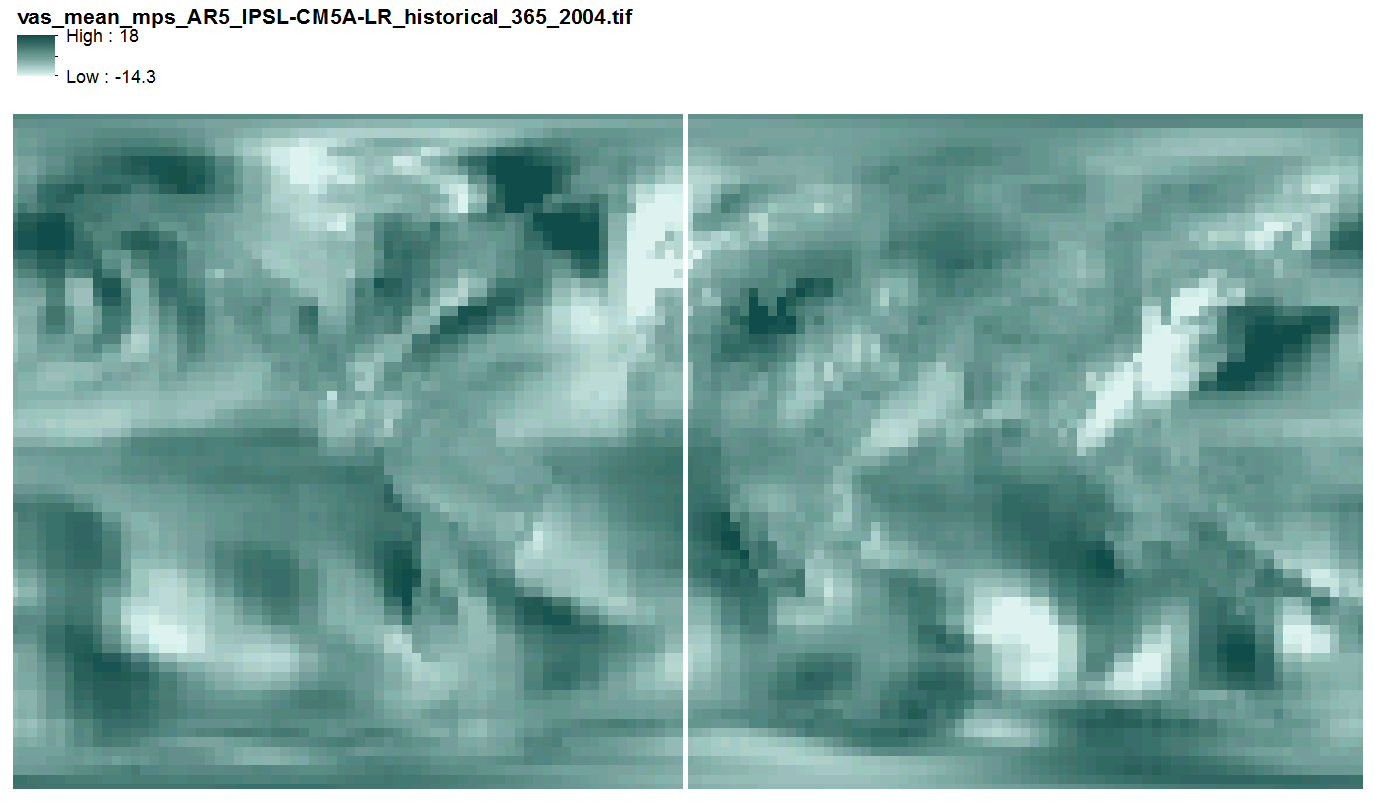
This data includes quantile-mapped historical and projected model runs of AR5 daily mean near surface wind velocity (m/s) for each day of every year from 1958 - 2100 at 2.5 x 2.5 degree spatial resolution across 3 AR5 models. They are 365 multi-band geotiff files, one file per year, each band representing one day of the year, with no leap years.
-
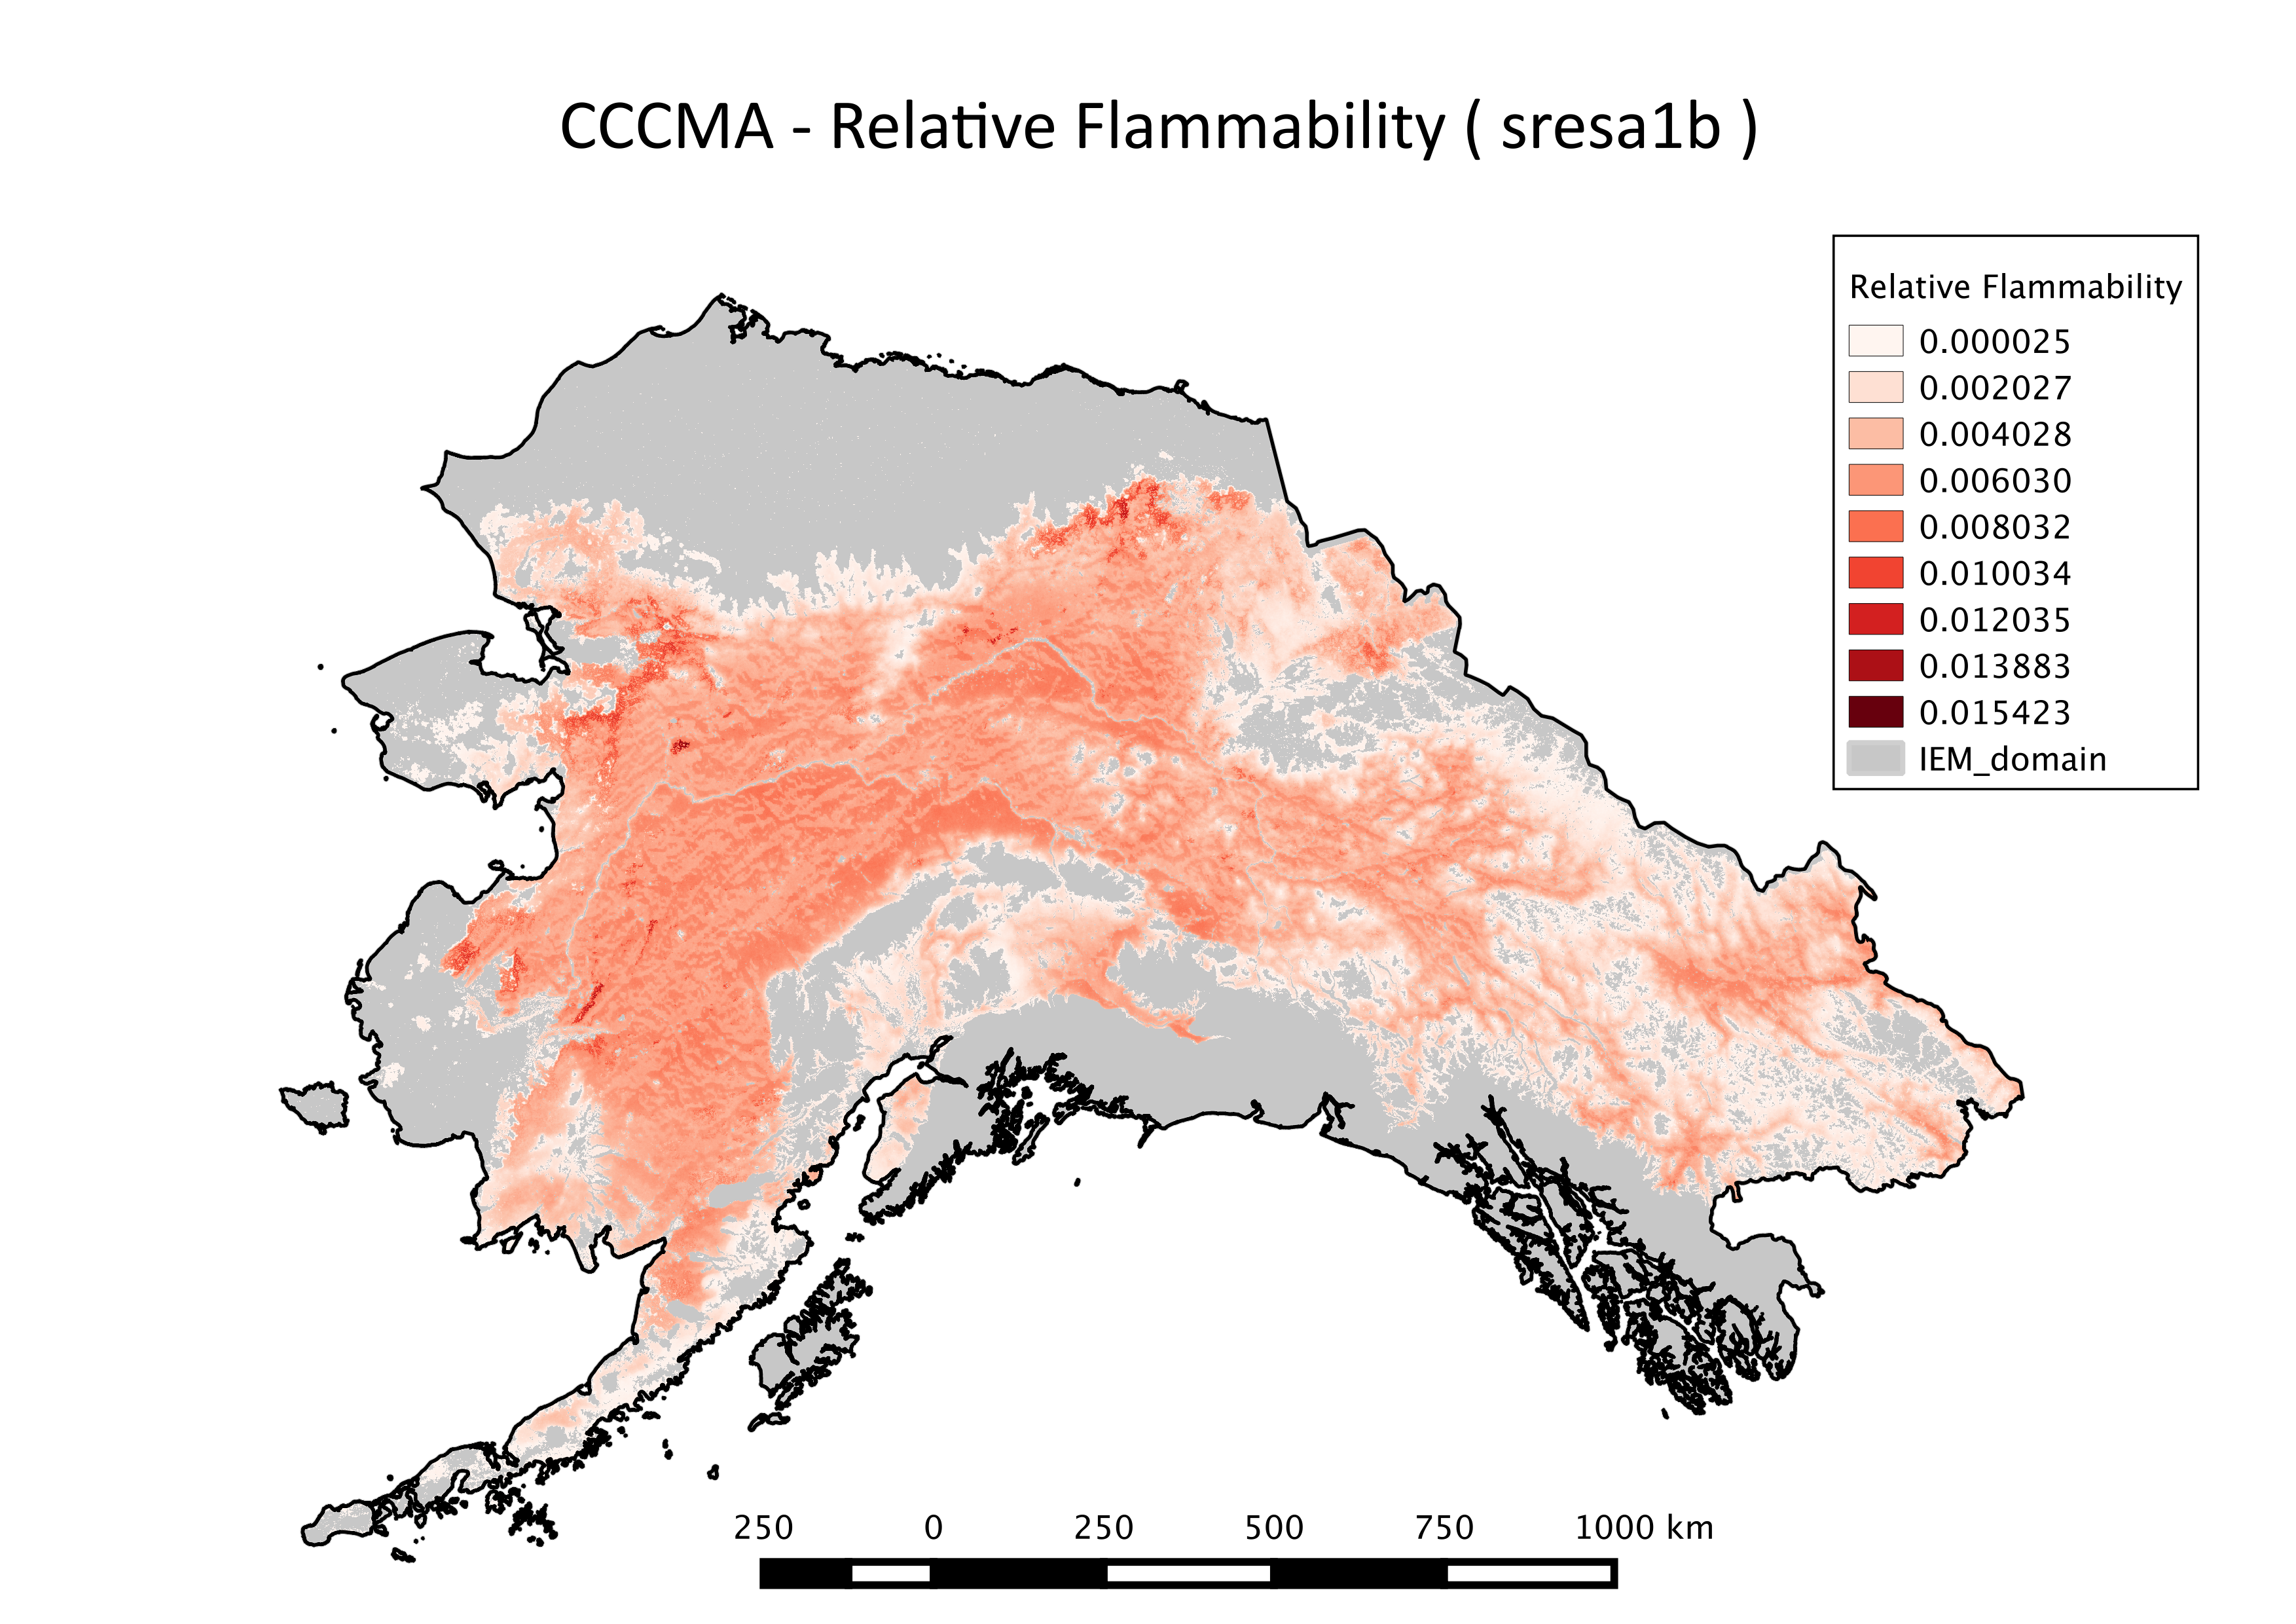
This file includes spatial representations of relative flammability produced through summarization of the ALFRESCO model outputs. These specific outputs are from the Integrated Ecosystem Model (IEM) project, and are from the linear coupled version using AR5/CMIP5 climate inputs (IEM Generation 2). This dataset has been updated to include flammability data summarized over additional time scales as well, done in the same manner as the intial dataset. These ALFRESCO outputs were summarized over three future eras (2010-2039, 2040-2069, 2070-2099) and a historical era (1950-2008), for two future emissions scenarios for five CMIP5 models
-
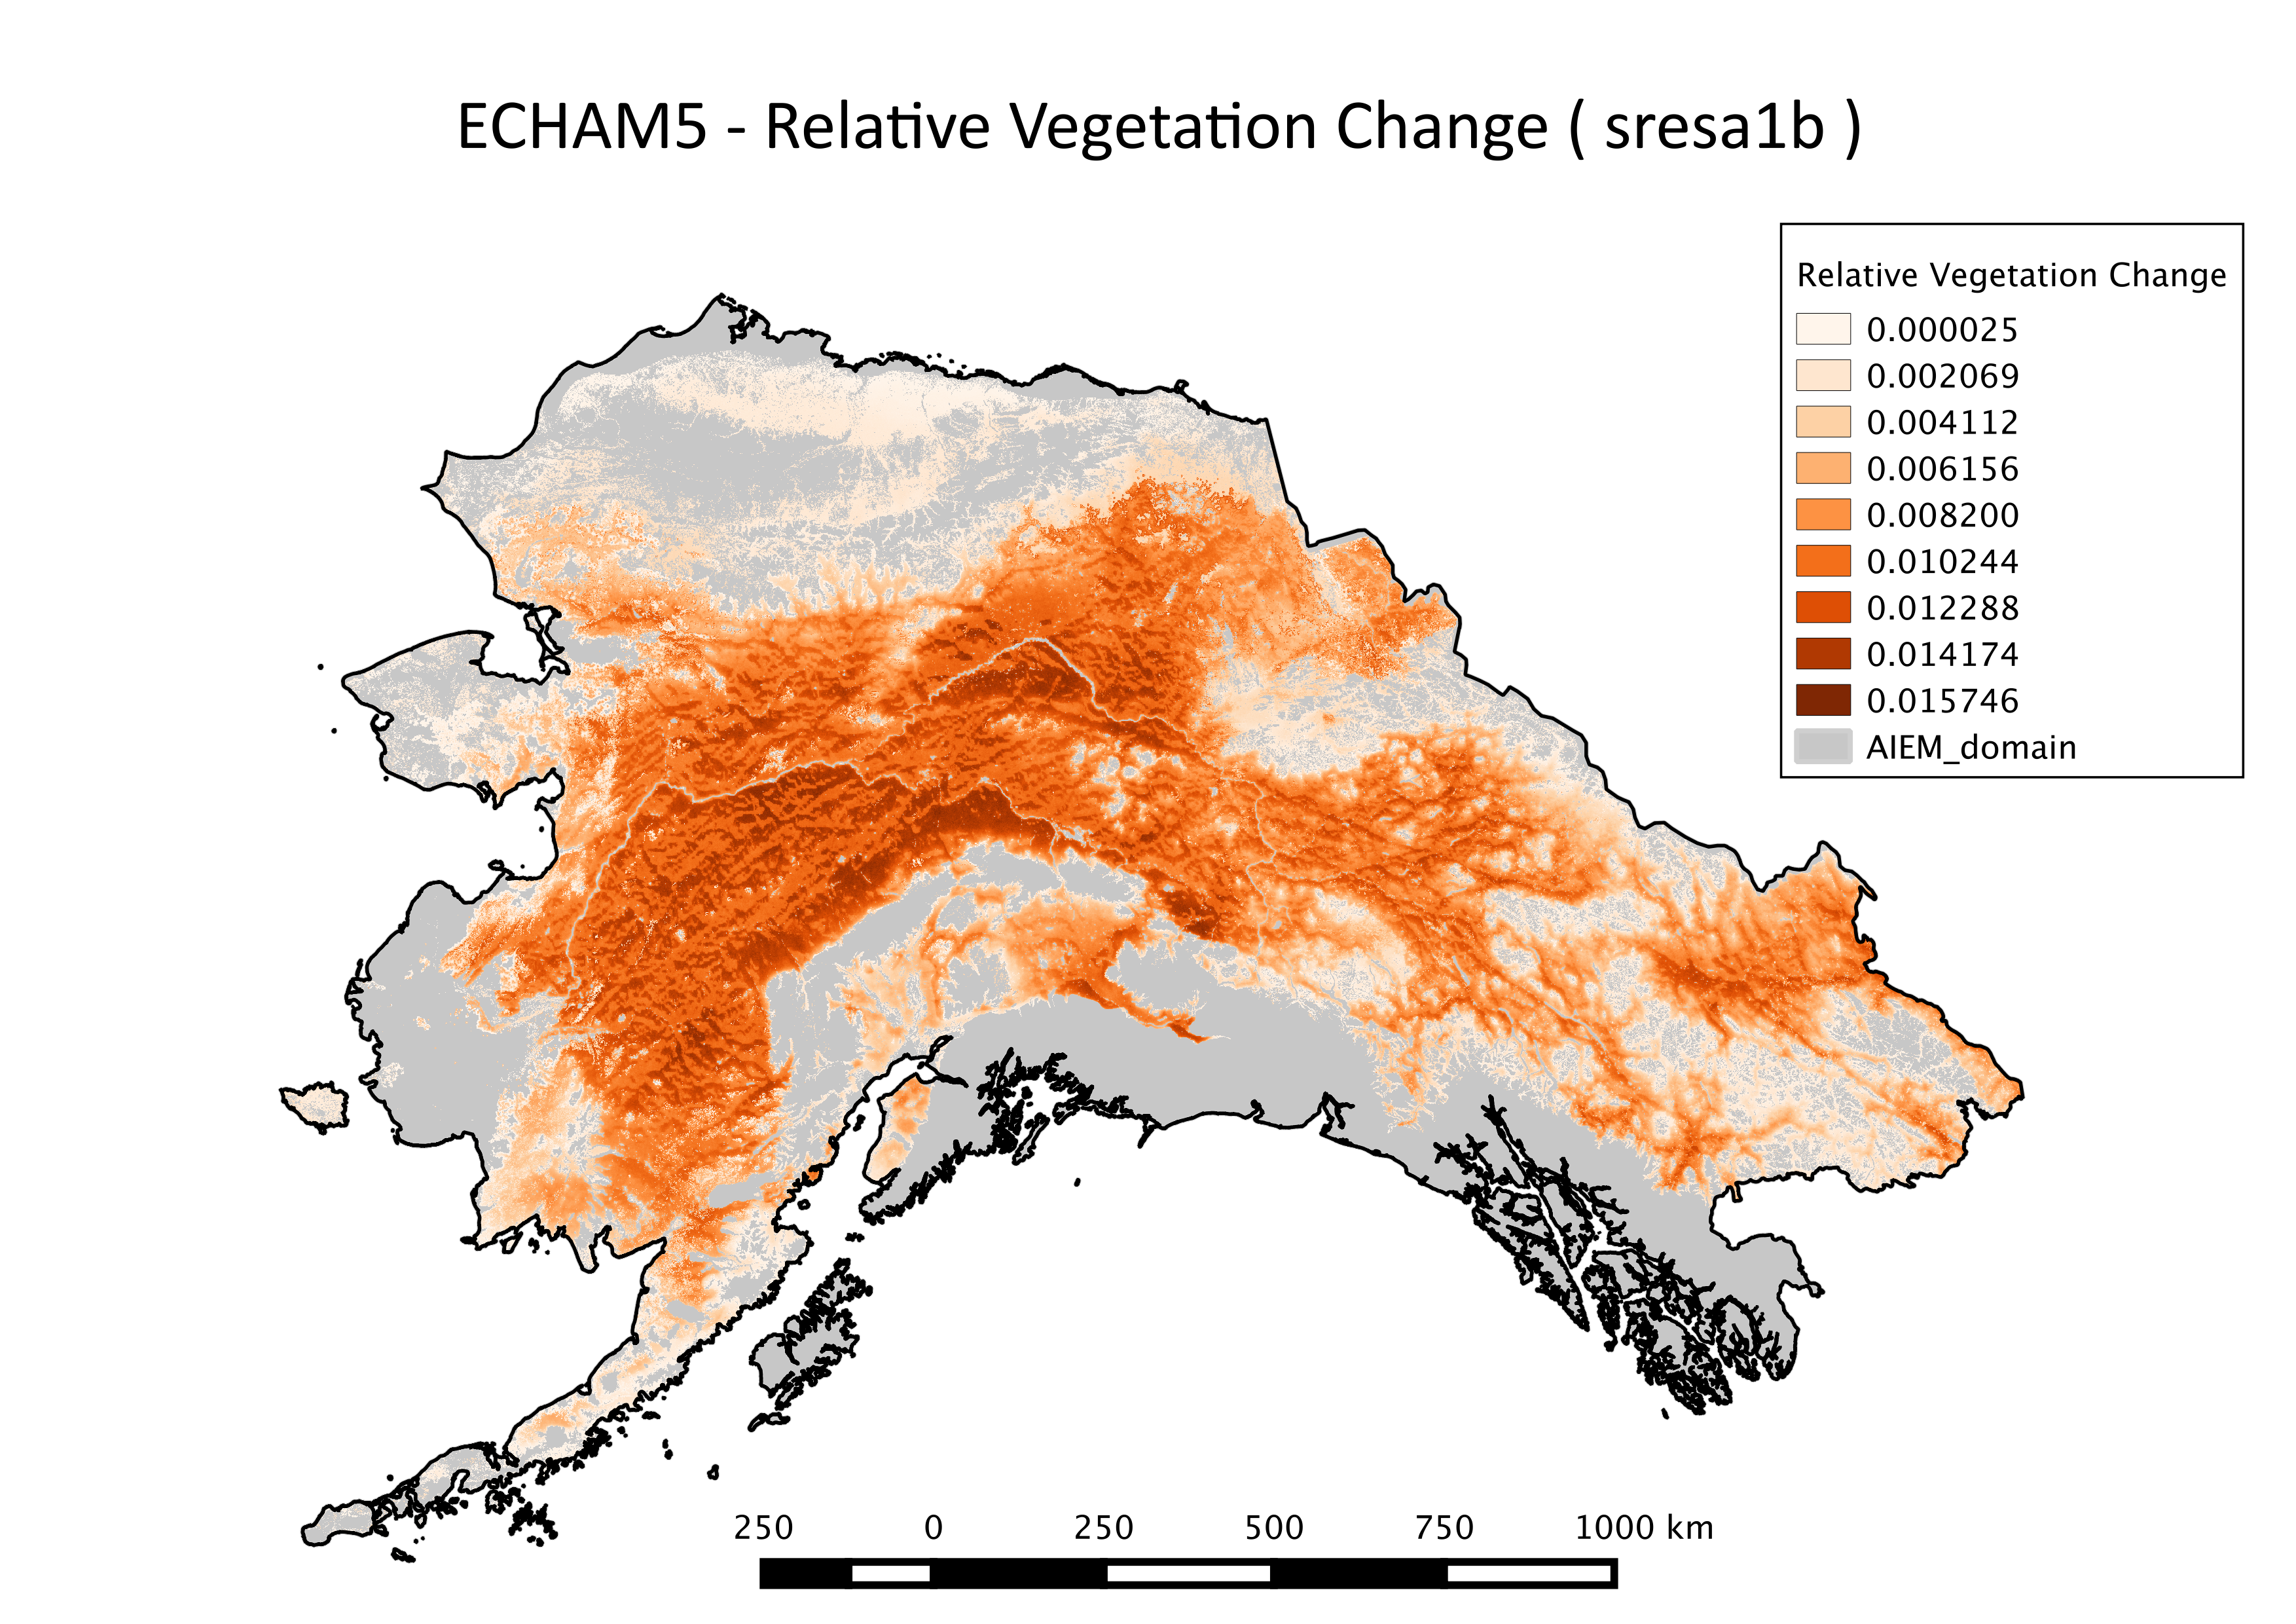
This dataset consists of spatial representations of relative vegetation change produced through summarization of ALFRESCO model outputs. These specific outputs are from the Integrated Ecosystem Model (IEM) project, and are from the linear coupled version using AR5/CMIP5 climate inputs (IEM Generation 2).
-

This set of files includes downscaled projected estimates of monthly total precipitation (in mm, no unit conversion necessary) from 2006-2300 (or 2006-2100, as some datasets from the five models used in modeling work by SNAP only have data going out to 2100) at 15km x 15km spatial resolution. They include data for Alaska and Western Canada. Each set of files originates from one of five top ranked global circulation models from the CMIP5/AR5 models and RPCs, or is calculated as a 5 Model Average. The downscaling process utilizes CRU CL v. 2.1 climatological datasets from 1961-1990 as the baseline for the Delta Downscaling method. Please note that these maps represent climatic estimates only. While we have based our work on scientifically accepted data and methods, uncertainty is always present. Uncertainty in model outputs tends to increase for more distant climatic estimates from present day for both historical summaries and future projections.
-

This dataset consists of 6000 GeoTIFFs produced by the Geophysical Institute Permafrost Lab (GIPL) Permafrost Model. Six distinct CMIP5 model-scenario combinations were used to force the GIPL model output. Each model-scenario combination includes annual (2021-2120) summaries of the following ten variables: - Mean Annual Ground Temperature (MAGT) at 0.5 m below the surface (°C) - MAGT at 1 m below the surface (°C) - MAGT at 2 m below the surface (°C) - MAGT at 3 m below the surface (°C) - MAGT at 4 m below the surface (°C) - MAGT at 5 m below the surface (°C) - Mean Annual Surface (i.e., 0.01 m depth) Temperature (°C) - Permafrost top (upper boundary of the permafrost, depth below the surface in m) - Permafrost base (lower boundary of the permafrost, depth below the surface in m) - Talik thickness (perennially unfrozen ground occurring in permafrost terrain, m) There are 1000 GeoTIFF files per model-scenario combination. The model-scenario combinations are: - GFDL-CM3, RCP 4.5 - GFDL-CM3, RCP 8.5 - NCAR-CCSM4, RCP 4.5 - NCAR-CCSM4, RCP 8.5 - A 5-Model (GFDL-CM3, NCAR-CCSM4, GISS-E2-R, IPSL-CM5A-LR, MRI-CGCM3) Average, RCP 8.5 - A 5-Model (GFDL-CM3, NCAR-CCSM4, GISS-E2-R, IPSL-CM5A-LR, MRI-CGCM3) Average, RCP 4.5 The file naming convention is `gipl_model_scenario_variable_year.tif` for example: `gipl_GFDL-CM3_rcp45_talikthickness_m_2090.tif` Each GeoTIFF uses the Alaska Albers (EPSG:3338) projection and has a spatial resolution of 1 km x 1 km. All rasters in this dataset have indentical extents, spatial references, and metadata objects. Once extracted, the entire dataset (all 6000 GeoTIFFs) requires 39 GB of disk space. Data are compressed into ten .zip files, one per variable. Each archive will contain all model-scenario combinations and all years for that variable. Each .zip file contains 600 GeoTIFFs. This research was funded by the Broad Agency Announcement Program and the U.S. Army Engineer Research and Development Center and Cold Regions Research and Engineering Laboratory (ERDC-CRREL) under Contract No. W913E521C0010. The GIPL2-MPI/GCM simulations were supported in part by the high-performance computing and data storage resources operated by the Research Computing Systems Group at the University of Alaska Fairbanks Geophysical Institute.
-

Rain on snow (ROS) events were derived from 20km dynamically downscaled ERA-Interim reanalysis and global climate model (GCM) climate projections data. The GCM data were from RCP 8.5 of GFDL-CM3 and NCAR-CCSM4. The amount of liquid precipitation for each day is provided in the database for each grid cell and was determined to be a ROS event by the temperature being at or near freezing and/or the presence of snow on the ground.
-
This dataset includes quantile-mapped historical and projected model runs of AR5 daily mean mean temperature (tas, degrees C) for each day of every year from 1958 - 2100 at 2.5 x 2.5 degree spatial resolution across 3 CMIP5 models. They are 365 multi-band geotiff files, one file per year, each band representing one day of the year, with no leap years.
-
This dataset consists of spatial representations of vegetation types produced through summarization of ALFRESCO model outputs. These specific outputs are from the Integrated Ecosystem Model (IEM) project, AR5/CMIP5 climate inputs (IEM Generation 2). ALFRESCO outputs were summarized over three future eras (2010-2039, 2040-269, 2070-2099) and a historical era (1950-2008). Both the proportions of all possible vegetation types and the modal vegetation type (most common type over a given era) are available as sub-datasets. Each are summarized over two future emissions scenarios for five CMIP5 models.