 SNAP GeoNetwork
temperature
Type of resources
Topics
Keywords
Contact for the resource
Provided by
Years
Formats
Representation types
Update frequencies
status
Resolution
-
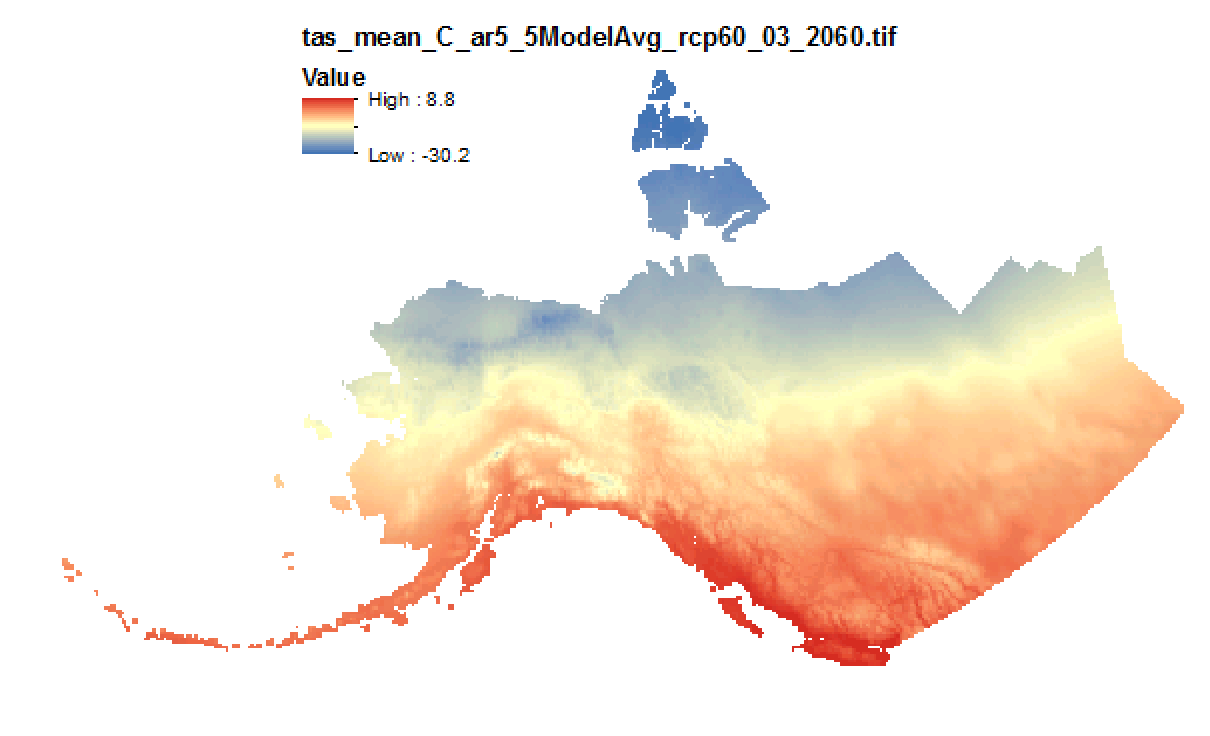
This set of files includes downscaled projected estimates of monthly temperature (in degrees Celsius, no unit conversion necessary) from 2006-2300* at 15km x 15km spatial resolution. They include data for Alaska and Western Canada. Each set of files originates from one of five top ranked global circulation models from the CMIP5/AR5 models and RCPs, or is calculated as a 5 Model Average. *Some datasets from the five models used in modeling work by SNAP only have data going out to 2100. This metadata record serves to describe all of these models outputs for the full length of future time available. The downscaling process utilizes CRU CL v. 2.1 climatological datasets from 1961-1990 as the baseline for the Delta Downscaling method.
-
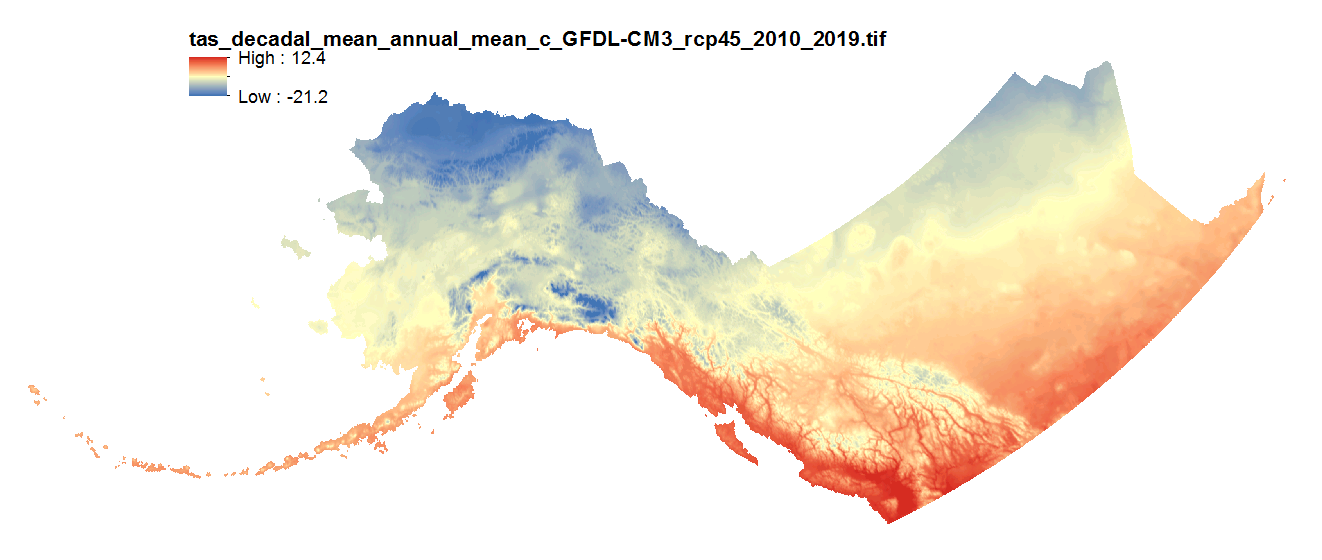
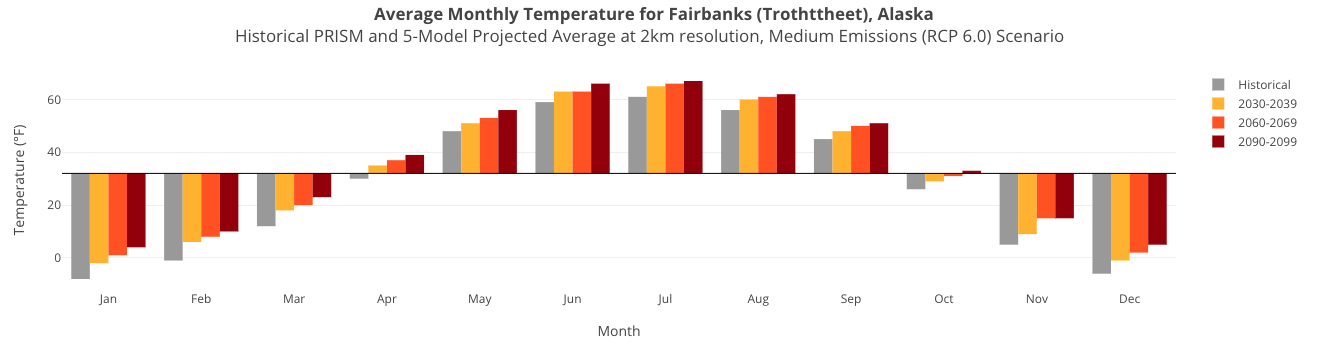
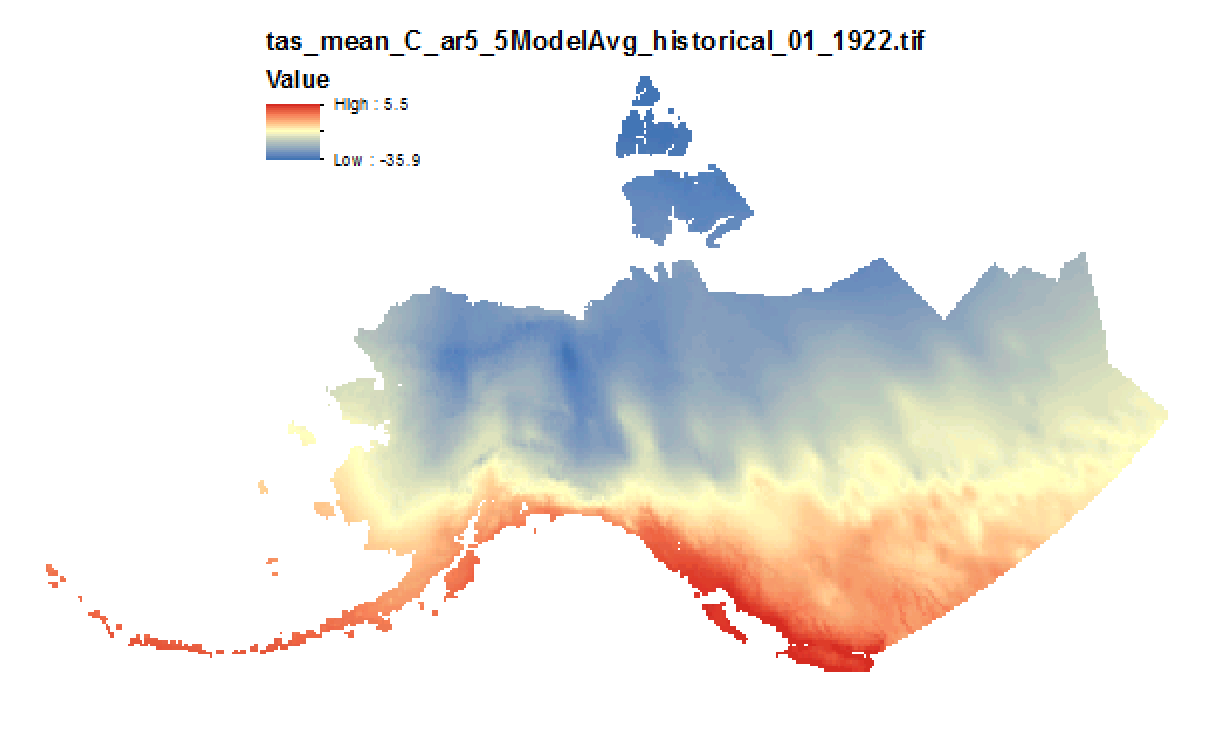
This set of files includes downscaled projections of monthly average, minimum, and maximum temperature and derived annual, seasonal, and decadal means of monthly average temperature (in degrees Celsius, no unit conversion necessary) from Jan 2006 - Dec 2100 at 2km x 2km spatial resolution across Alaska and parts of Canada. For seasonal means, the four seasons are referred to by the first letter of 3 months making up that season: * `JJA`: summer (June, July, August) * `SON`: fall (September, October, November) * `DJF`: winter (December, January, February) * `MAM`: spring (March, April, May) Each set of files originates from one of five top ranked global circulation models from the CMIP5/AR5 models and RPCs, or is calculated as a 5 Model Average. The downscaling process utilizes PRISM climatological datasets from 1961-1990. Please note that these maps represent climatic estimates only. While we have based our work on scientifically accepted data and methods, uncertainty is always present. Uncertainty in model outputs tends to increase for more distant climatic estimates from present day for both historical summaries and future projections.
-
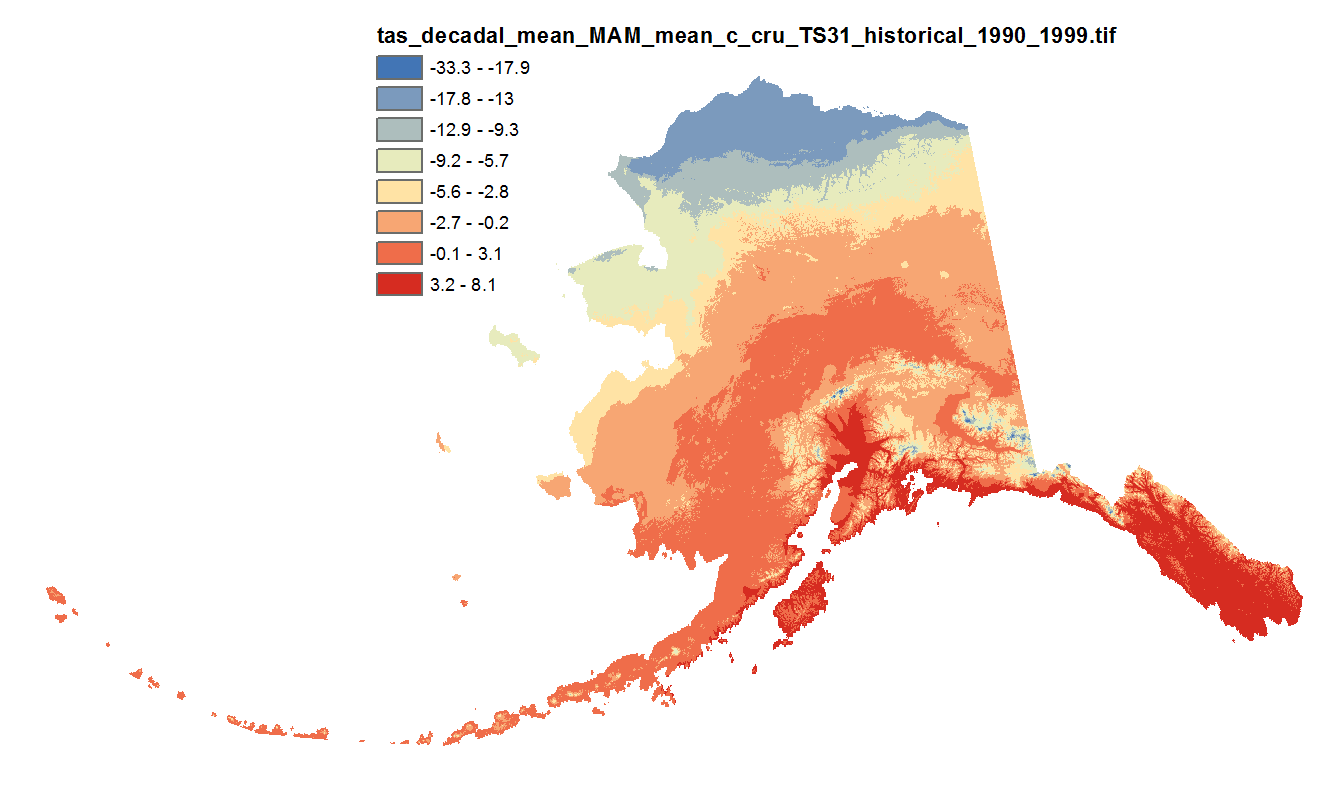
This set of files includes downscaled projections of monthly totals, and derived annual, seasonal, and decadal means of monthly average temperature (in degrees Celsius, no unit conversion necessary) from 1901 - 2006 (CRU TS 3.0) or 2009 (CRU TS 3.1) at 771 x 771 meter spatial resolution.
-
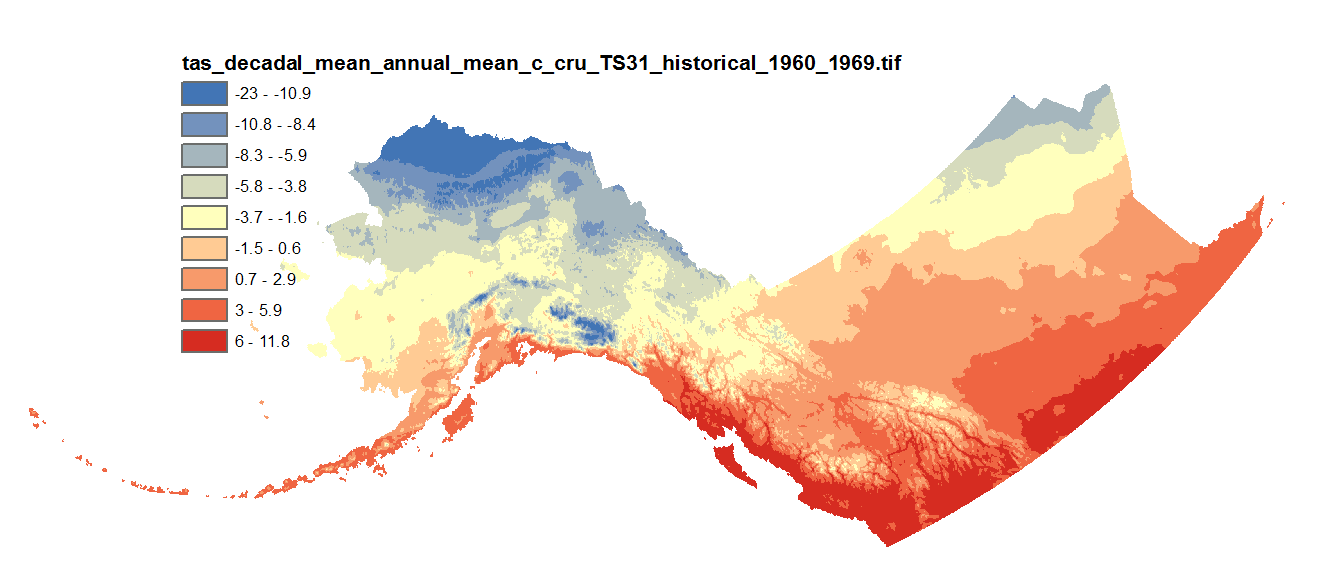
This dataset includes downscaled historical estimates of monthly average, minimum, and maximum temperature and derived annual, seasonal, and decadal means of monthly average temperature (in degrees Celsius, no unit conversion necessary) from 1901 to 2006 (CRU TS 3.0), 2009 (CRU TS 3.1), 2015 (CRU TS 4.0), 2020 (CRU TS 4.05), or 2023 (CRU TS 4.08) at 2km x 2km spatial resolution. CRU TS 4.0 is only available as monthly averages, minimum, and maximum files. CRU TS 4.05 and 4.08 are only available as monthly averages. The downscaling process utilizes PRISM climatological datasets from 1961-1990.
-
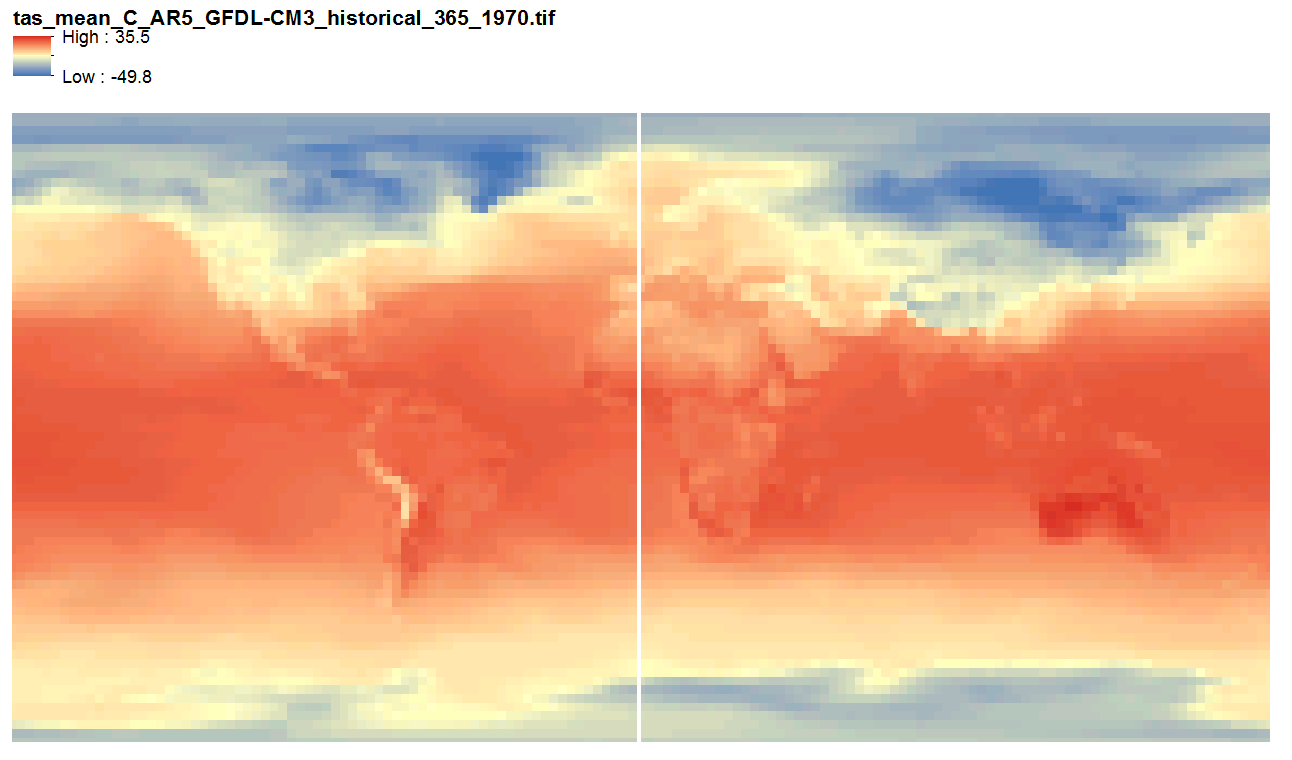
This dataset includes quantile-mapped historical and projected model runs of AR5 daily mean mean temperature (tas, degrees C) for each day of every year from 1958 - 2100 at 2.5 x 2.5 degree spatial resolution across 3 CMIP5 models. They are 365 multi-band geotiff files, one file per year, each band representing one day of the year, with no leap years.
-
Mean temperature and precipitation values extracted at community locations across Alaska and Canada from downscaled raster datasets containing historical and projected estimates for these variables.
-

This set of files includes downscaled historical estimates of monthly temperature (in degrees Celsius, no unit conversion necessary) from 1901 - 2013 (CRU TS 3.22) at 10 min x 10 min spatial resolution. The downscaling process utilizes CRU CL v. 2.1 climatological datasets from 1961-1990.
-
This set of files includes downscaled modeled historical estimates of monthly temperature (in degrees Celsius, no unit conversion necessary) from 1901 - 2005 at 15km x 15km spatial resolution. Each set of files originates from one of five top-ranked global circulation models from the CMIP5/AR5 models and RCPs or is calculated as a 5 Model Average. These outputs are from the Historical runs of the GCMs. The downscaling process utilizes CRU CL v. 2.1 climatological datasets from 1961-1990 as the baseline for the Delta Downscaling method.
-

This dataset consists of four different variables: degree days below 65°F (or "heating degree days"), degree days below 0°F, degree days below 32°F (or "air freezing index"), and degree days above 32°F (or "air thawing index"). All were derived from the same set of nine statistically downscaled CMIP5 global climate model outputs driven by RCP 4.5 and RCP 8.5 emissions scenarios. A historical baseline (Daymet, 1980-2017) dataset is included for each variable. All data are in GeoTIFF format and have a spatial resolution of 12 km. Units are degree days Fahrenheit (°F⋅days). The model-scenario combinations are: - ACCESS1-3, RCP 4.5 - ACCESS1-3, RCP 8.5 - CanESM2, RCP 4.5 - CanESM2, RCP 8.5 - CCSM4, RCP 4.5 - CCSM4, RCP 8.5 - CSIRO-Mk3-6-0, RCP 4.5 - CSIRO-Mk3-6-0, RCP 8.5 - GFDL-ESM2M, RCP 4.5 - GFDL-ESM2M, RCP 8.5 - inmcm4, RCP 4.5 - inmcm4, RCP 8.5 - MIROC5, RCP 4.5 - MIROC5, RCP 8.5 - MPI-ESM-MR, RCP 4.5 - MPI-ESM-MR, RCP 8.5 - MRI-CGCM3, RCP 4.5 - MRI-CGCM3, RCP 8.5 The .zip files that are available for download are organized by variable. One .zip file has all the models and scenarios and years for that variable. Each GeoTIFF file has a naming convention like this: "ncar_12km_{model}_{scenario}_{variable}_{year}_Fdays.tif" Each GeoTIFF has a 12 km by 12 km pixel size, and is projected to EPSG:3338 (Alaska Albers).
-

This dataset contains climate "indicators" (also referred to as climate indices or metrics) computed over one historical period (1980-2009) using the NCAR Daymet dataset, and two future periods (2040-2069, 2070-2099) using two statistically downscaled global climate model projections, each run under two plausible greenhouse gas futures (RCP 4.5 and 8.5). The indicators within this dataset include: hd: “Hot day” threshold -- the highest observed daily maximum 2 m air temperature such that there are 5 other observations equal to or greater than this value. cd: “Cold day” threshold -- the lowest observed daily minimum 2 m air temperature such that there are 5 other observations equal to or less than this value. rx1day: Maximum 1-day precipitation su: "Summer Days" –- Annual number of days with maximum 2 m air temperature above 25 C dw: "Deep Winter days" –- Annual number of days with minimum 2 m air temperature below -30 C wsdi: Warm Spell Duration Index -- Annual count of occurrences of at least 5 consecutive days with daily mean 2 m air temperature above 90th percentile of historical values for the date cdsi: Cold Spell Duration Index -- Same as WDSI, but for daily mean 2 m air temperature below 10th percentile rx5day: Maximum 5-day precipitation r10mm: Number of days with precipitation > 10 mm cwd: Consecutive wet days –- number of the most consecutive days with precipitation > 1 mm cdd: Consecutive dry days –- number of the most consecutive days with precipitation < 1 mm