 SNAP GeoNetwork
climate
Type of resources
Topics
Keywords
Contact for the resource
Provided by
Years
Formats
Representation types
Update frequencies
status
Resolution
-

This set of files includes downscaled historical estimates of monthly temperature (in degrees Celsius, no unit conversion necessary) from 1901 - 2013 (CRU TS 3.22) at 10 min x 10 min spatial resolution. The downscaling process utilizes CRU CL v. 2.1 climatological datasets from 1961-1990.
-
These wind speed and direction data are the underlying data displayed in the interactive webtool at http://snap.uaf.edu/tools/airport-winds. Original wind speed/direction observations were made by Automated Surface Observing System (ASOS) and the Automated Weather Observing System (AWOS) stations, and we accessed these data via the Iowa Environmental Mesonet (IEM). These observations were hourly in most cases, and we filtered data to routine measurements (nearest to clock hour) where measurements were more frequent than hourly to generate a true hourly dataset, save for periods of missing data. We used data from 166 weather stations located across Alaska, selected from a pool of 185 stations available in the IEM database for 1980-2019. For inclusion in the app and this dataset, a station must have a reasonably complete record, and must have begun measurements before June 6, 2010. We applied a spike-filtering algorithm to detect spurious spikes and dips, and a changepoint detection plus quantile mapping adjustment to statistically account for the possibility of sensors changing location, height, or surroundings such that the long term (month-scale) wind regimes were affected. **Methodology** --- All hourly ASOS/AWOS wind speed and direction data available via the Iowa Environmental Mesonet AK ASOS network were accessed and assessed for completeness (185 stations), and 166 of those stations were determined to be sufficiently complete for climatological analysis. Those data were cleaned to produce regular hourly data, and adjusted via a combination of changepoint analysis and quantile mapping to correct for potential changes in sensor location and height. **Attribute Description** --- ts: timestamp (YYYY-mm-dd HH:MM:SS) ws: wind speed (mph) wd: wind direction (degrees) Station identifiers used for locations is available at: https://www.faa.gov/air_traffic/weather/asos/?state=AK
-
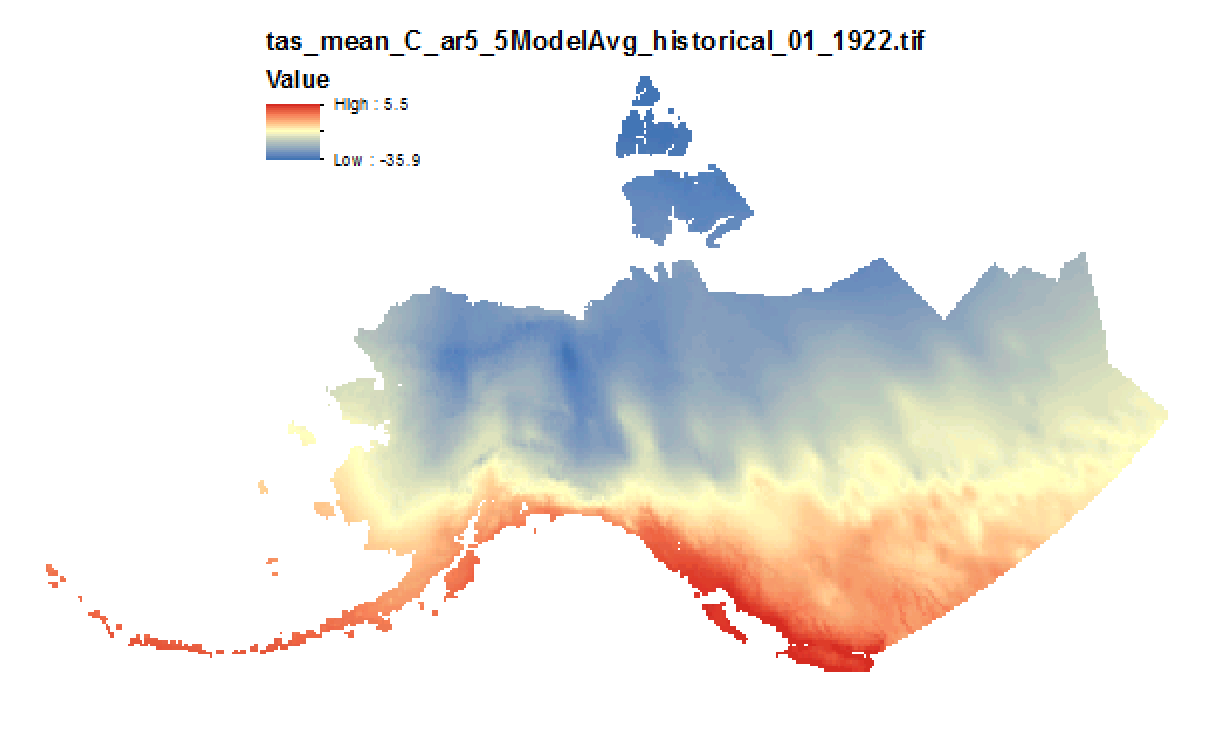
This set of files includes downscaled modeled historical estimates of monthly temperature (in degrees Celsius, no unit conversion necessary) from 1901 - 2005 at 15km x 15km spatial resolution. Each set of files originates from one of five top-ranked global circulation models from the CMIP5/AR5 models and RCPs or is calculated as a 5 Model Average. These outputs are from the Historical runs of the GCMs. The downscaling process utilizes CRU CL v. 2.1 climatological datasets from 1961-1990 as the baseline for the Delta Downscaling method.
-
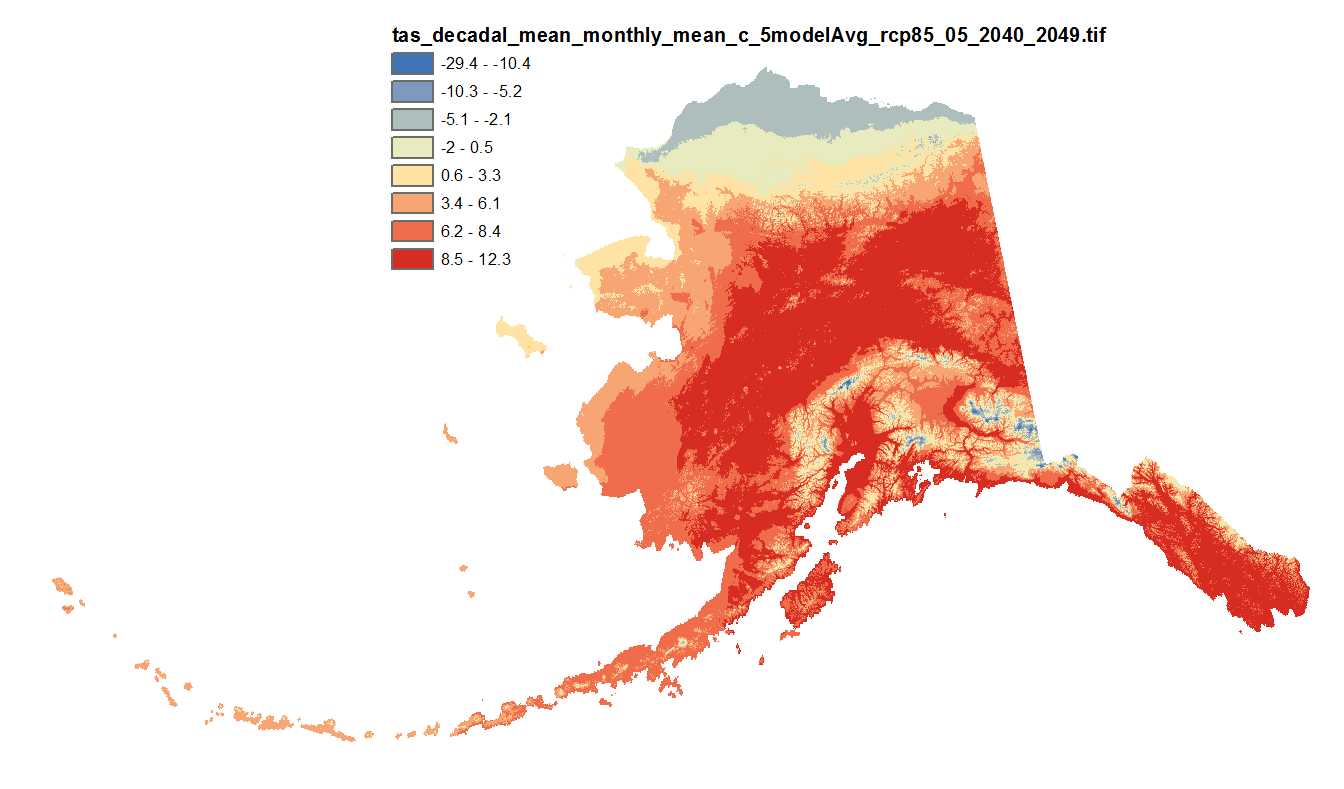
This set of files includes downscaled projections of monthly means, and derived annual, seasonal, and decadal means of monthly mean temperatures (in degrees Celsius, no unit conversion necessary) from Jan 2006 - Dec 2100 at 771x771 meter spatial resolution. For seasonal means, the four seasons are referred to by the first letter of 3 months making up that season: * `JJA`: summer (June, July, August) * `SON`: fall (September, October, November) * `DJF`: winter (December, January, February) * `MAM`: spring (March, April, May) The downscaling process utilizes PRISM climatological datasets from 1971-2000. Each set of files originates from one of five top-ranked global circulation models from the CMIP5/AR5 models and RCPs or is calculated as a 5 Model Average.
-

Annual maximum series-based precipitation frequency estimates with 90% confidence intervals for Alaska derived from WRF-downscaled reanalysis (ERA-Interim) and CMIP5 GCM (GFDL-CM3, NCAR-CCSM4) precipitation data with the RCP 8.5 scenario. Estimates and confidence intervals are based on exceedance probabilities and durations used in the NOAA Atlas 14 study. Projections are present for three future time periods: 2020-2049, 2050-2079, and 2080-2099.