 SNAP GeoNetwork
Alaska
Type of resources
Topics
Keywords
Contact for the resource
Provided by
Representation types
Update frequencies
status
Resolution
-
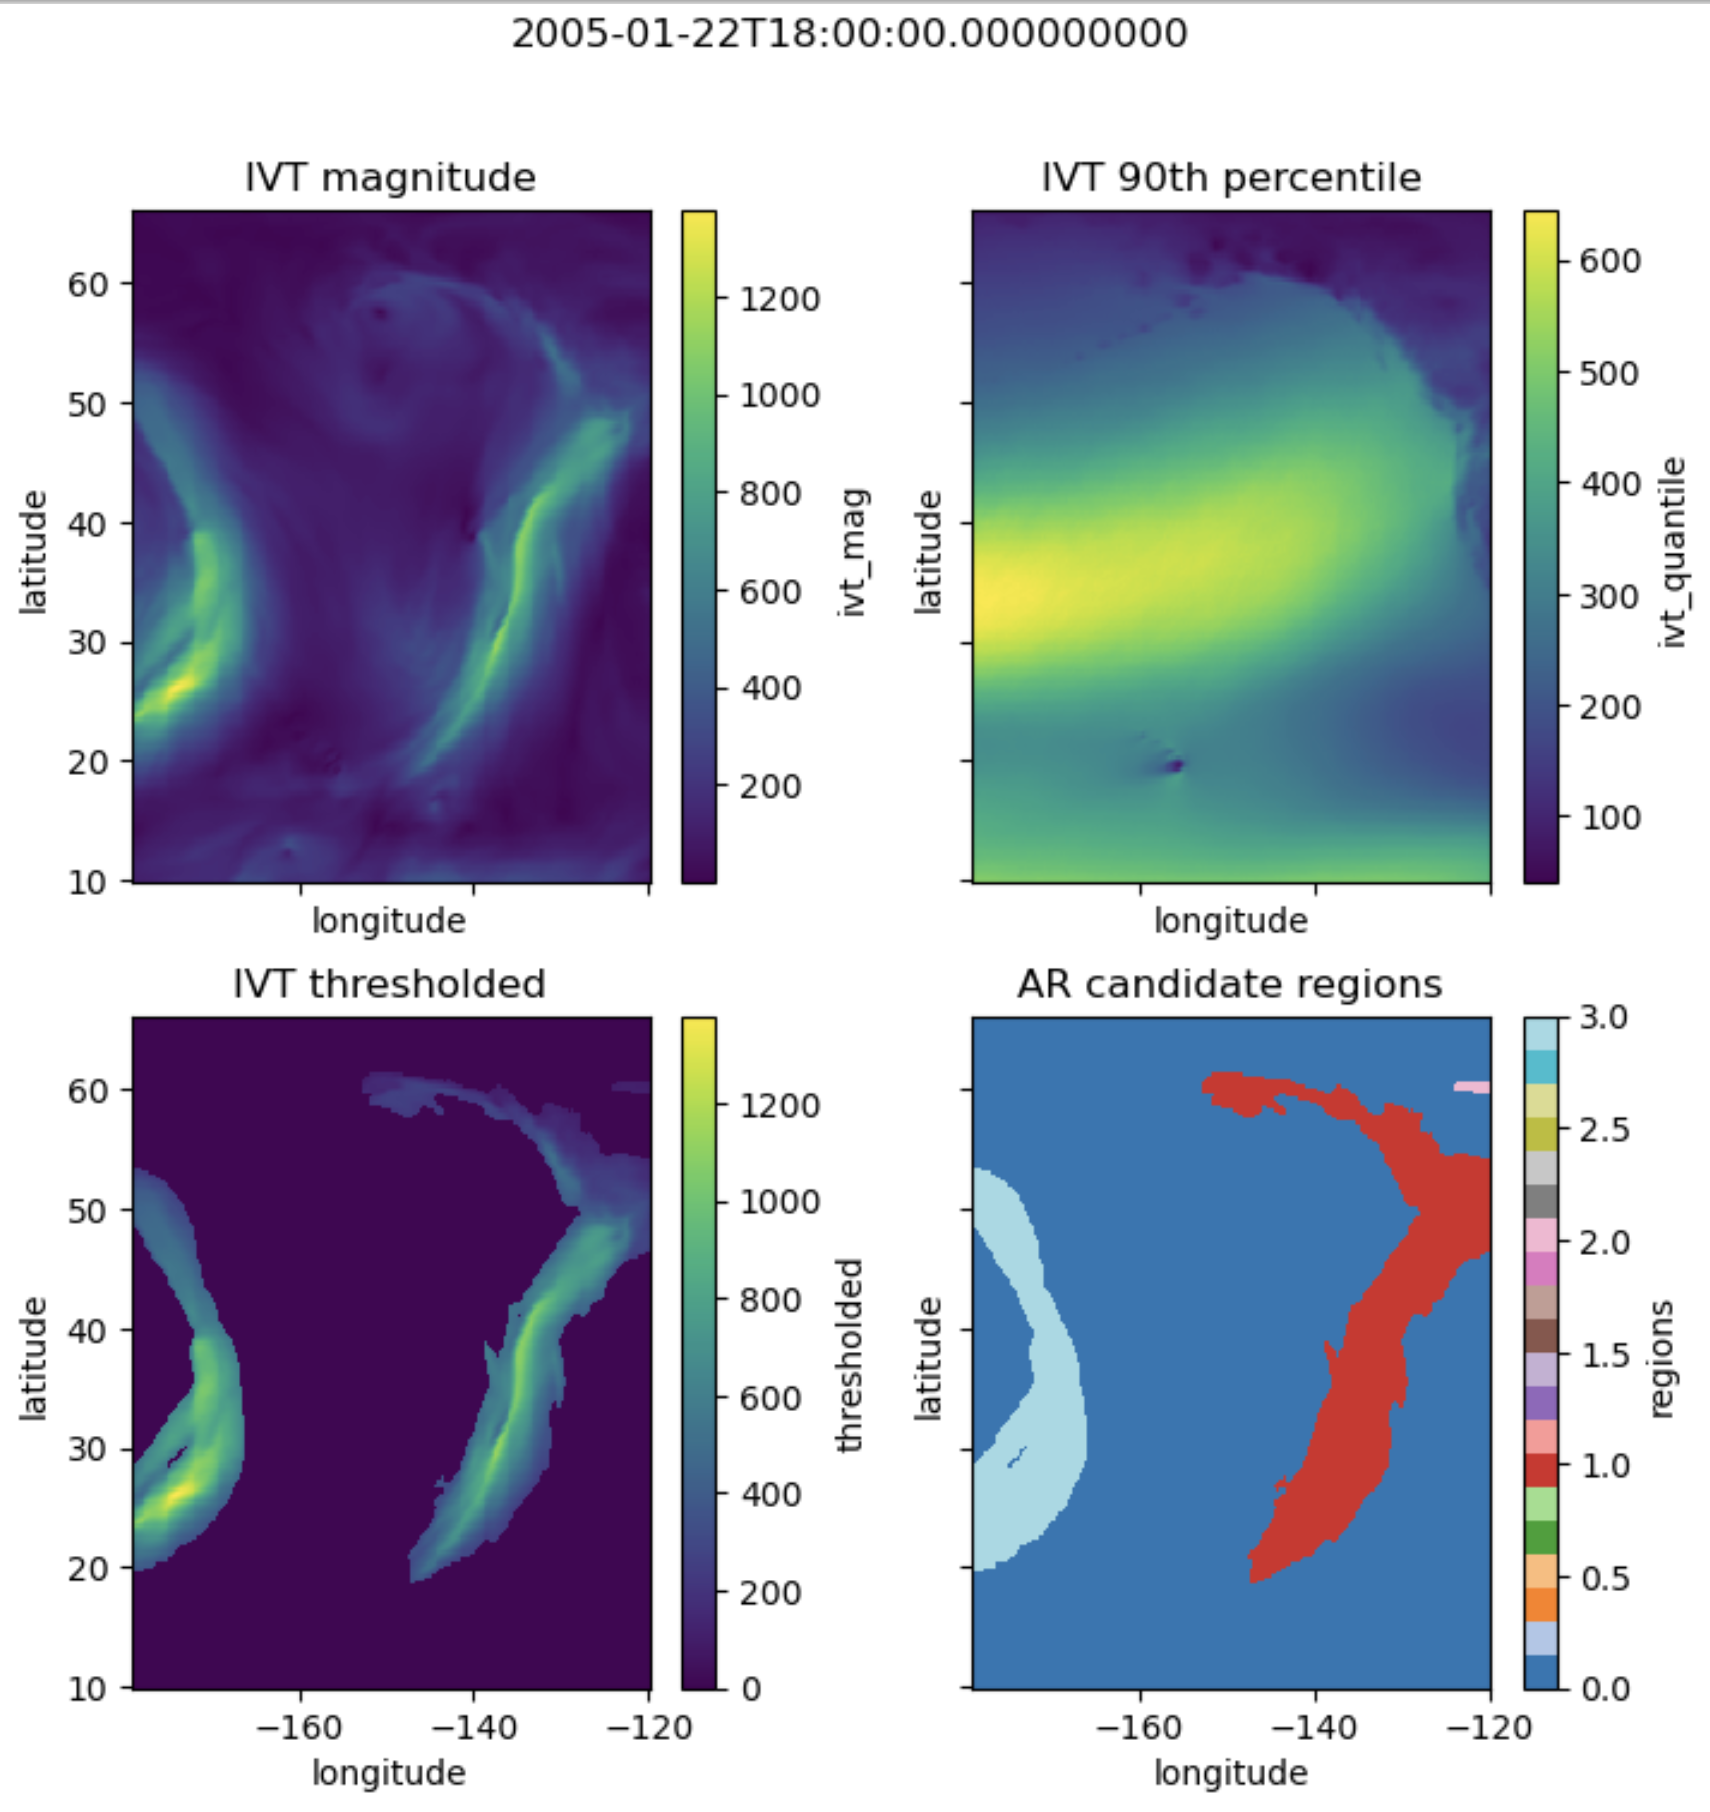
Atmospheric rivers (ARs) were detected from ERA5 6hr pressure level data, using a detection algorithm adapted from Guan & Waliser (2015). The algorithm uses a combination of vertically integrated water vapor transport (IVT), geometric shape, and directional criteria to define ARs. See the sources listed below and the GitHub repository for more detail and other references. The AR database is a zipped archive containing multiple attributed shapefiles. Polygon data includes individual timestep ARs, ARs making landfall in Alaska, and aggregated landfalling AR events. Point data includes coastal impact points landfalling AR events.
-
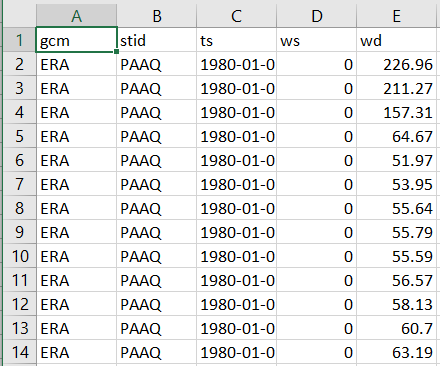
These wind speed and direction data are the underlying data displayed in the interactive webtool at http://snap.uaf.edu/tools/airport-winds. Original wind speed/direction observations were made by Automated Surface Observing System (ASOS) and the Automated Weather Observing System (AWOS) stations, and we accessed these data via the Iowa Environmental Mesonet (IEM). These observations were hourly in most cases, and we filtered data to routine measurements (nearest to clock hour) where measurements were more frequent than hourly to generate a true hourly dataset, save for periods of missing data. We used data from 166 weather stations located across Alaska, selected from a pool of 185 stations available in the IEM database for 1980-2019. For inclusion in the app and this dataset, a station must have a reasonably complete record, and must have begun measurements before June 6, 2010. We applied a spike-filtering algorithm to detect spurious spikes and dips, and a changepoint detection plus quantile mapping adjustment to statistically account for the possibility of sensors changing location, height, or surroundings such that the long term (month-scale) wind regimes were affected. **Methodology** --- All hourly ASOS/AWOS wind speed and direction data available via the Iowa Environmental Mesonet AK ASOS network were accessed and assessed for completeness (185 stations), and 166 of those stations were determined to be sufficiently complete for climatological analysis. Those data were cleaned to produce regular hourly data, and adjusted via a combination of changepoint analysis and quantile mapping to correct for potential changes in sensor location and height. **Attribute Description** --- ts: timestamp (YYYY-mm-dd HH:MM:SS) ws: wind speed (mph) wd: wind direction (degrees) Station identifiers used for locations is available at: https://www.faa.gov/air_traffic/weather/asos/?state=AK
-
This dataset consists of observed and modeled wind data at an hourly temporal resolution for 67 communities in Alaska. Hourly ASOS/AWOS wind data (speed and direction) available via the Iowa Environmental Mesonet AK ASOS network were accessed and assessed for completeness, and 67 of those stations were determined to be sufficiently complete for climatological analysis. Those data were cleaned to produce regular hourly data, and adjusted via a combination of changepoint analysis and quantile mapping to correct for potential changes in sensor location and height. Historical (ERA-Interim reanalysis) and projected (GFDL-CM3 and NCAR-CCSM4) outputs from a dynamical downscaling effort were extracted at pixels intersecting the chosen communities and were bias-corrected using the cleaned station data. This bias-corrected historical and projected data along with cleaned station data make up the entirety of this dataset as a collection of CSV files, for each combination of community and origin (station or model name).
-

Annual maximum series-based precipitation frequency estimates with 90% confidence intervals for Alaska derived from WRF-downscaled reanalysis (ERA-Interim) and CMIP5 GCM (GFDL-CM3, NCAR-CCSM4) precipitation data with the RCP 8.5 scenario. Estimates and confidence intervals are based on exceedance probabilities and durations used in the NOAA Atlas 14 study. Projections are present for three future time periods: 2020-2049, 2050-2079, and 2080-2099.