 SNAP GeoNetwork
sea ice
Type of resources
Topics
Keywords
Contact for the resource
Provided by
Years
Formats
Representation types
Update frequencies
status
Resolution
-
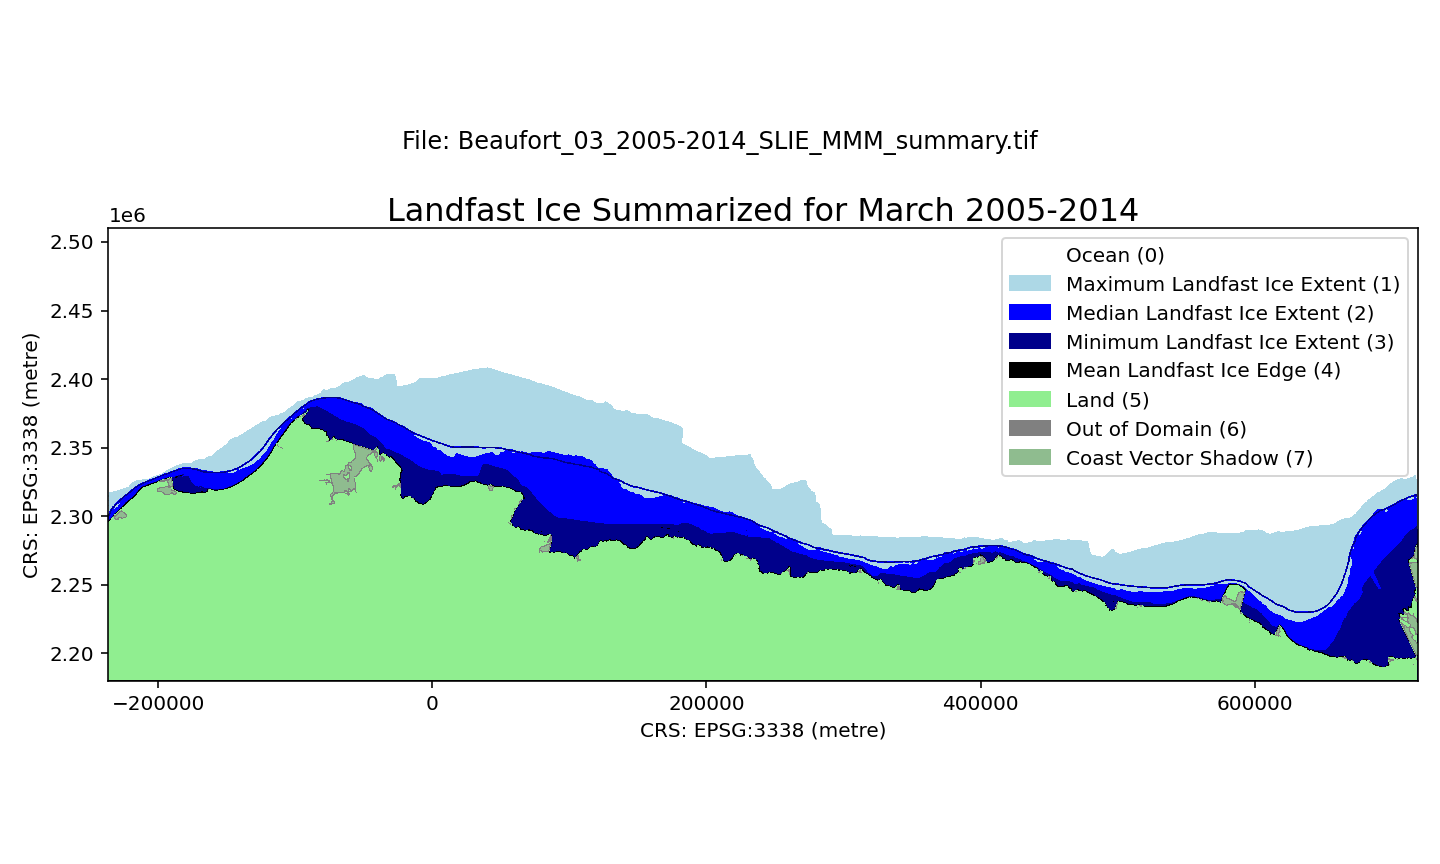
A landfast ice dataset along the Beaufort Sea continental shelf, spanning 1996-2023. Spatial resolution is 100 m. Each month of the ice season (October through July) is summarized over three 9-year periods (1996-2005, 2005-2014, 2014-2023) using the minimum, maximum, median, and mean distance of SLIE from the coastline. The minimum extent indicates the region that was always occupied by landfast ice during a particular calendar month. The median extent indicates where landfast occurred at least 50% of the time. The maximum extent represents regions that may only have been landfast ice on one occasion during the selected time period. The mean SLIE position for the each month and and time period is also included. The dataset is derived from three sources: seaward landfast ice images derived from synthetic aperture radar images from the RadarSAT and EnviSAT constellations (1996-2008), the Alaska Sea Ice Program (ASIP) ice charts (2008-2017, 2019-2022), and the G10013 SIGID-3 Arctic Ice Charts produced by the National Ice Center (NIC; 2017-2019, 2022-2023). Within each GeoTIFF file there are 8 different pixel values representing different characteristics: 0 - Ocean 1 - Maximum Landfast Ice Extent 2 - Median Landfast Ice Extent 3 - Minimum Landfast Ice Extent 4 - Mean Landfast Ice Edge 5 - Land 6 - Out of Domain 7 - Coast Vector Shadow The file naming convention is as follows: Beaufort_$month_$era_SLIE_MMM_summary.tif For example, the name Beaufort_05_2005-2014_SLIE_MMM_summary.tif indicates the file represents data for May 2005-2014.
-
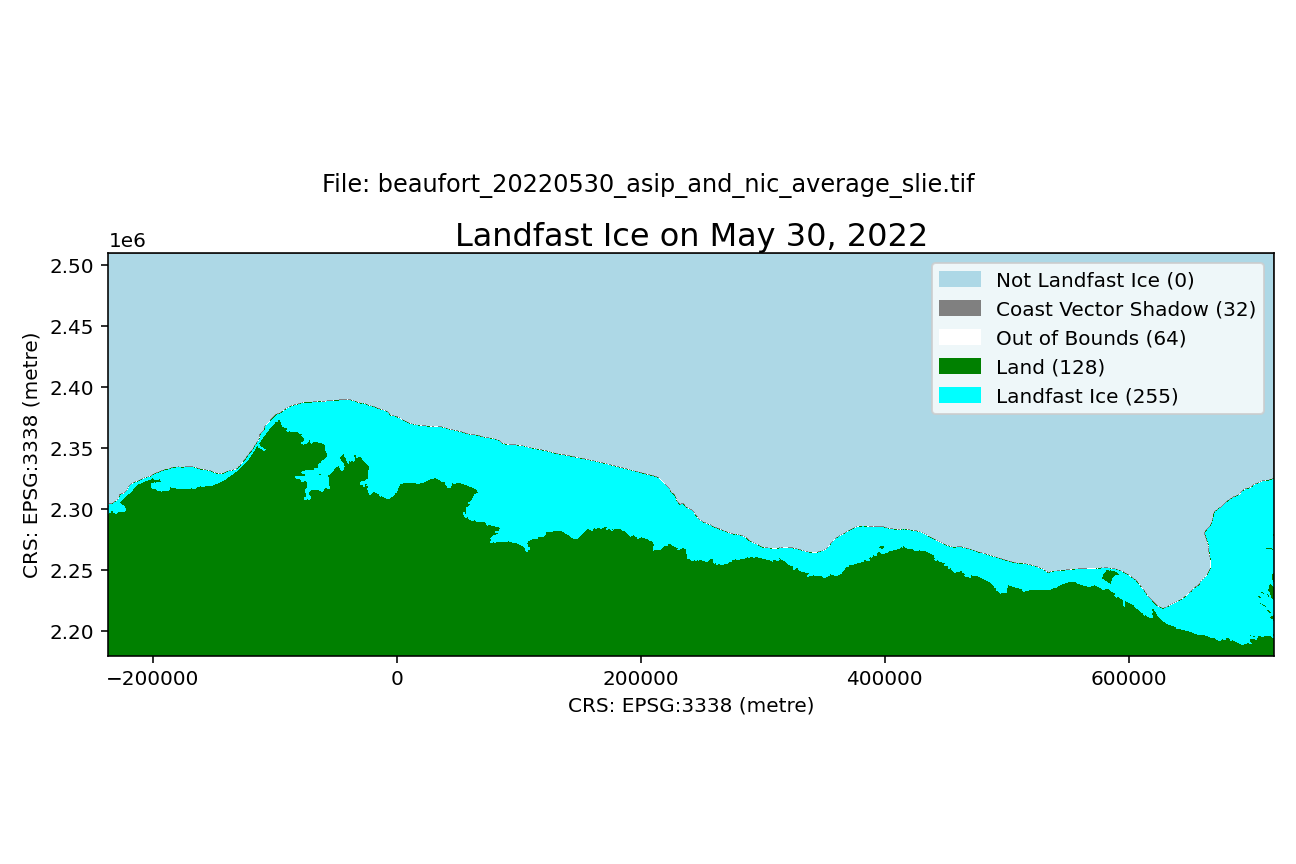
A dataset of landfast ice extent along the Alaska coast of the Beaufort Sea and adjacent waters in Canada spanning the winters of 1996-2023. Landfast ice extent is defined as the area between the coast and the seaward landfast ice edge (SLIE), meaning that small areas of open water than can form at the coast springtime will not be represented. Spatial resolution is 100 m. Compilation of the dataset is described in detail by Mahoney et al (2024). In brief, it is derived from three sources: From 1996-2008, the dataset is derived from analysis of sequential synthetic aperture radar (SAR) images from the RadarSAT and EnviSAT constellations, as described by Mahoney et al (2014); From 2008-2023, the data represent an average landfast extent identified in ice charts from the U.S. National Weather Service Alaska Sea Ice Program (ASIP) and the U.S. National Ice Center (NIC). Within each GeoTIFF file there are 5 different pixel values representing different characteristics: 0 - Not Landfast Ice 32 - Coast Vector Shadow 64 - Out of Bounds 128 - Land 255 - Landfast ice The file naming convention is as follows: beaufort_$YYYYMMDD_$source_slie.tif For example, the name beaufort_20170302_asip_and_nic_average_slie.tif indicates the file represents data for March 2, 2017 and that the data is derived from an average of the ASIP and NIC data sources.
-
This data set includes weekly (January 1954 to December 2013) and monthly (January 1850 to December 2022) midpoint historical sea ice concentration (0 - 100%) estimates at 1/4 x 1/4 degree spatial resolution for the ocean region around the state of Alaska, USA. This value-added dataset was developed by compiling the below historical data sources into spatially and temporally standardized datasets. Gaps in temporal or spatial resolutions were filled in with spatial and temporal analog month approaches. This dataset is no longer being updated. The NSIDC provides a new version in netCDF format receiving ongoing updates: https://nsidc.org/data/nsidc-0051/versions/2.
-
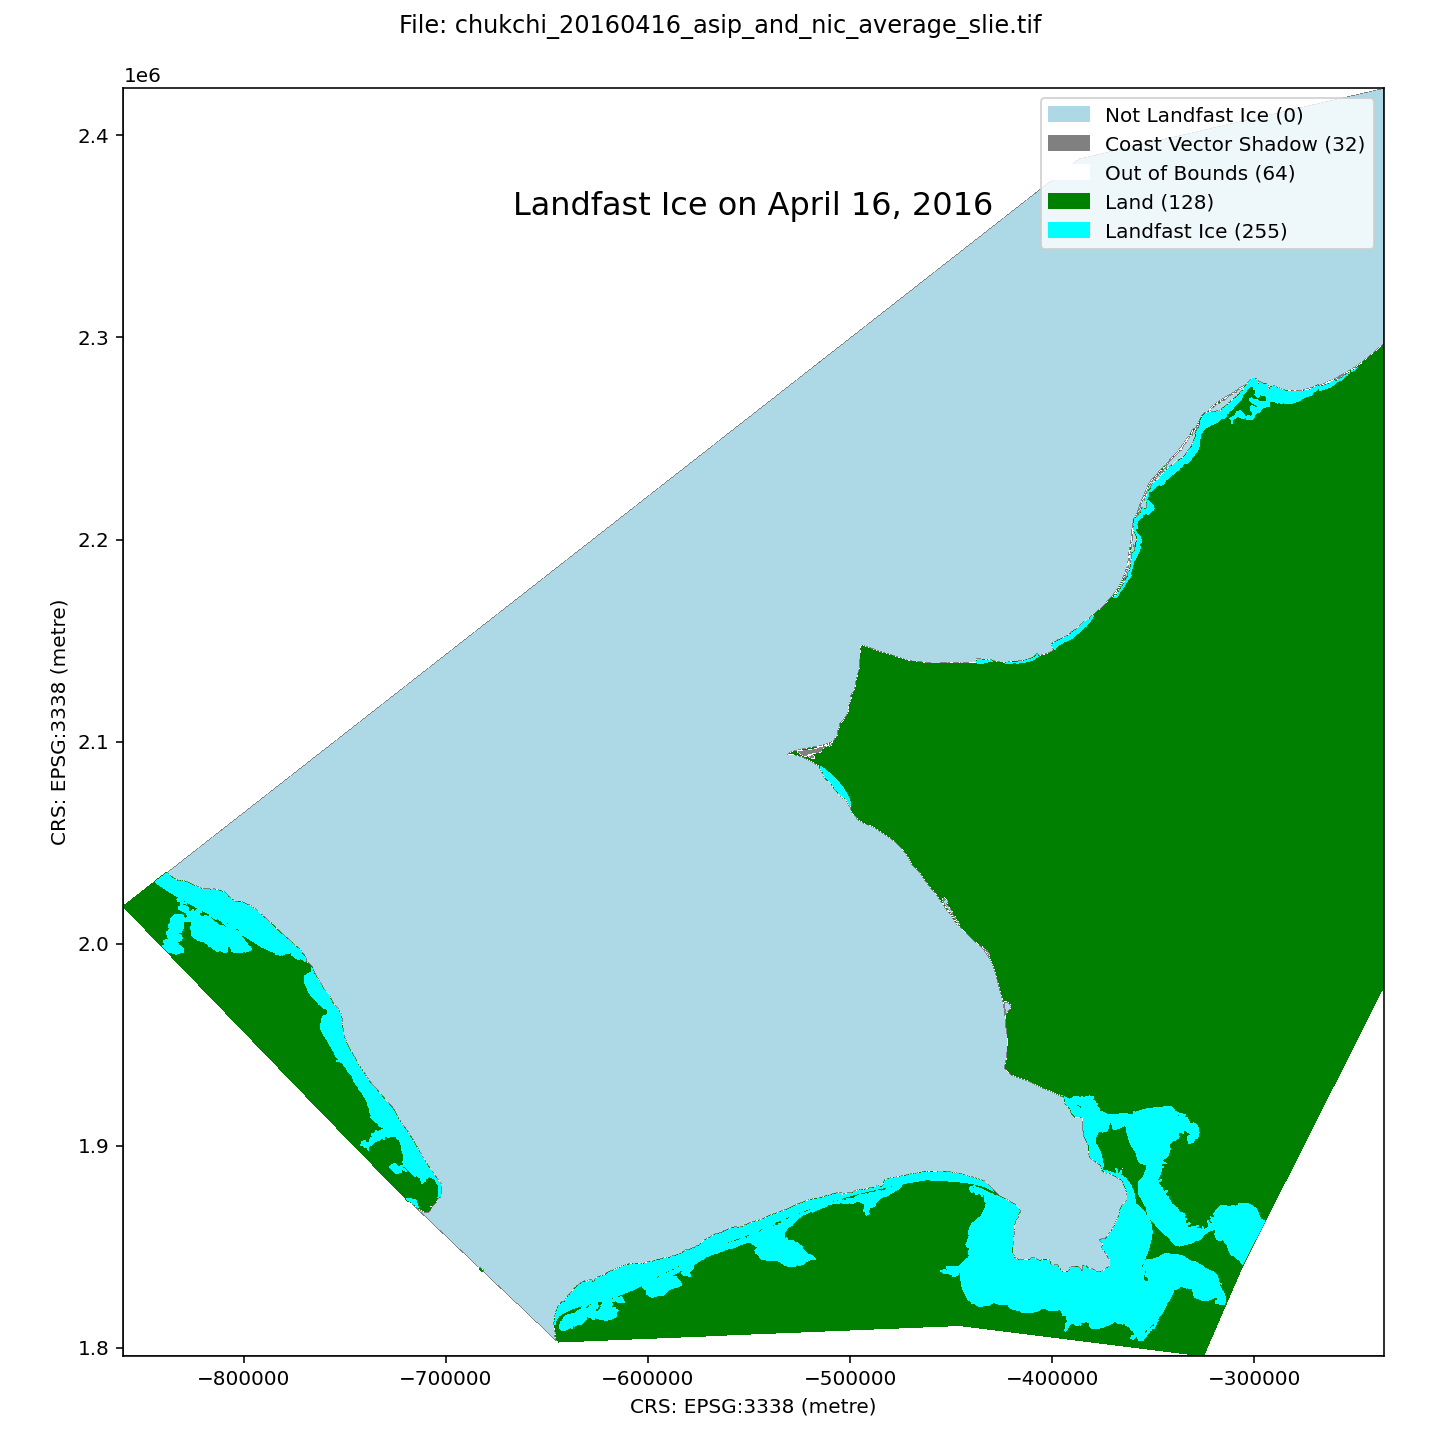
A dataset of landfast ice extent along the Alaska coast of the Chukchi Sea and adjacent waters in Russia, spanning the winters of 1996-2023. Landfast ice extent is defined as the area between the coast and the seaward landfast ice edge (SLIE), meaning that small areas of open water than can form at the coast springtime will not be represented. Spatial resolution is 100 m. Compilation of the dataset is described in detail by Mahoney et al (2024). In brief, it is derived from three sources: From 1996-2008, the dataset is derived from analysis of sequential synthetic aperture radar (SAR) images from the RadarSAT and EnviSAT constellations, as described by Mahoney et al (2014); From 2008-2023, the data represent an average landfast extent identified in ice charts from the U.S. National Weather Service Alaska Sea Ice Program (ASIP) and the U.S. National Ice Center (NIC). Within each GeoTIFF file there are 5 different pixel values representing different characteristics: 0 - Not Landfast Ice 32 - Coast Vector Shadow 64 - Out of Bounds 128 - Land 255 - Landfast ice The file naming convention is as follows: chukchi_$YYYYMMDD_$source_slie.tif For example, the name chukchi_20170302_asip_and_nic_average_slie.tif indicates the file represents data for March 2, 2017 and that the data is derived from an average of the ASIP and NIC data sources.
-
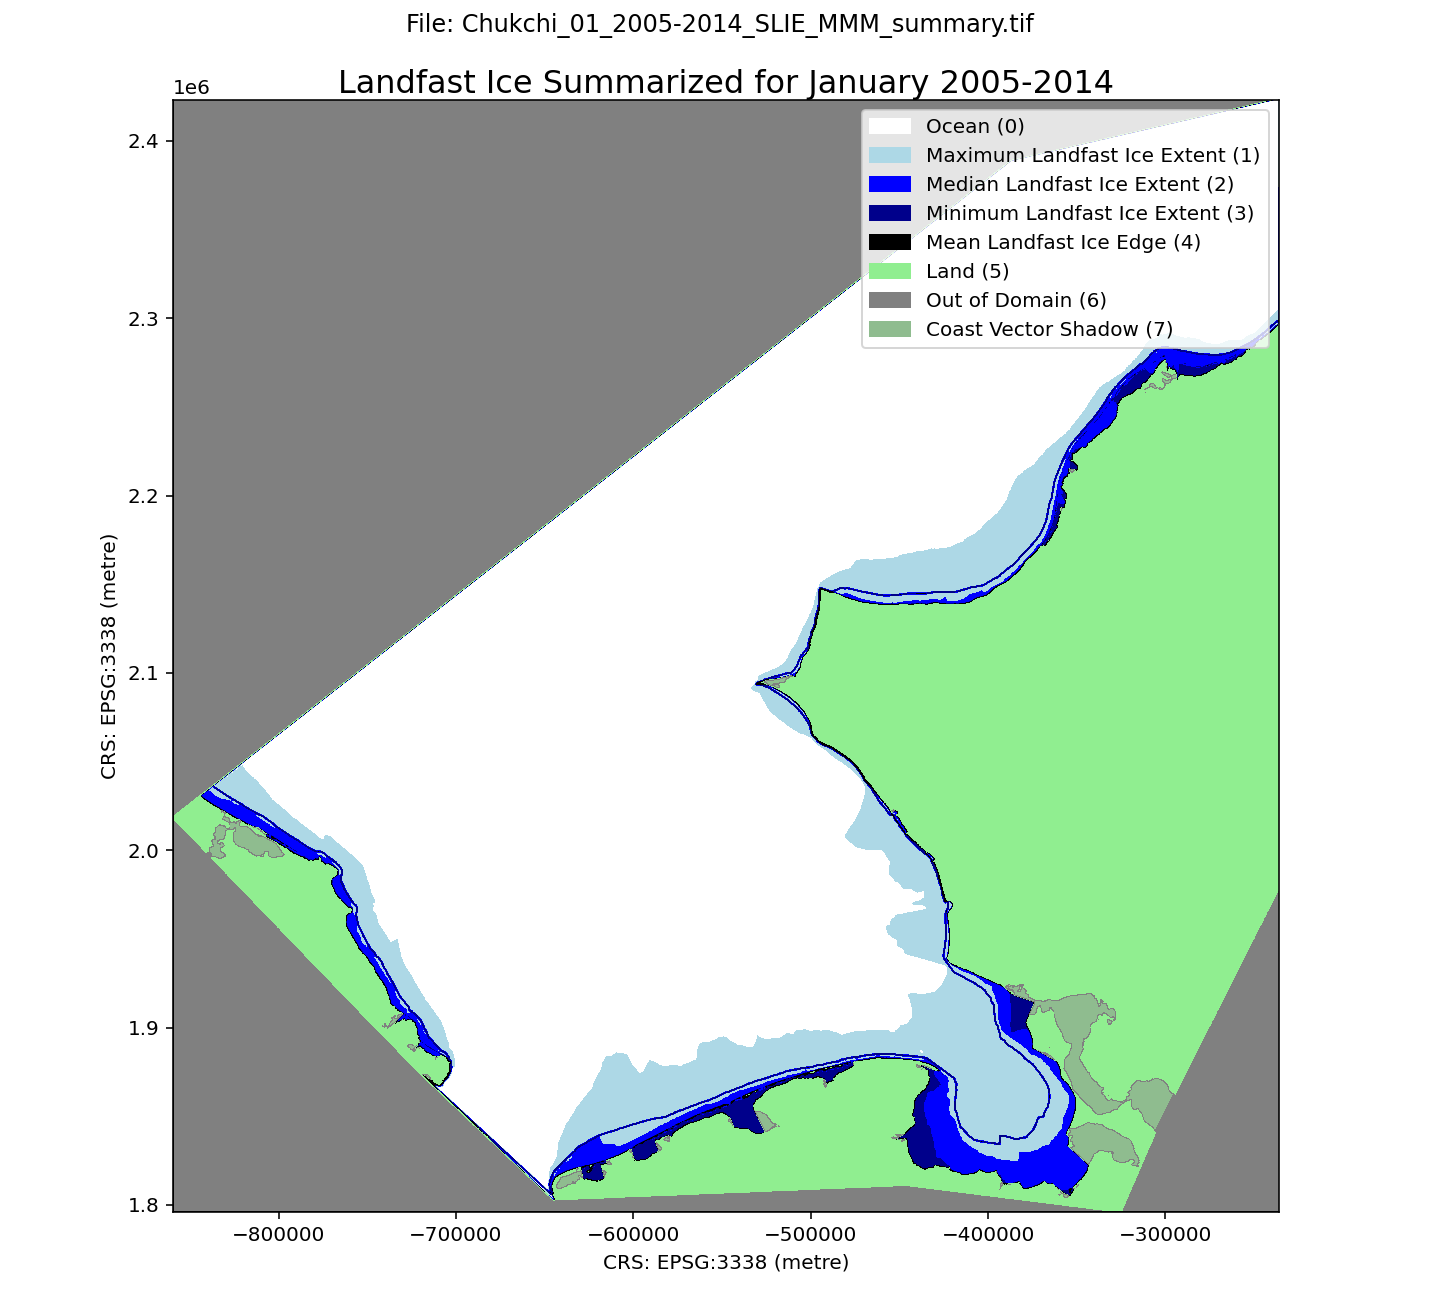
A landfast ice dataset along the Chukchi Sea continental shelf, spanning 1996-2023. Spatial resolution is 100 m. Each month of the ice season (October through July) is summarized over three 9-year periods (1996-2005, 2005-2014, 2014-2023) using the minimum, maximum, median, and mean distance of SLIE from the coastline. The minimum extent indicates the region that was always occupied by landfast ice during a particular calendar month. The median extent indicates where landfast occurred at least 50% of the time. The maximum extent represents regions that may only have been landfast ice on one occasion during the selected time period. The mean SLIE position for the each month and and time period is also included. The dataset is derived from three sources: seaward landfast ice images derived from synthetic aperture radar images from the RadarSAT and EnviSAT constellations (1996-2008), the Alaska Sea Ice Program (ASIP) ice charts (2008-2017, 2019-2022), and the G10013 SIGID-3 Arctic Ice Charts produced by the National Ice Center (NIC; 2017-2019, 2022-2023). Within each GeoTIFF file there are 8 different pixel values representing different characteristics: 0 - Ocean 1 - Maximum Landfast Ice Extent 2 - Median Landfast Ice Extent 3 - Minimum Landfast Ice Extent 4 - Mean Landfast Ice Edge 5 - Land 6 - Out of Domain 7 - Coast Vector Shadow The file naming convention is as follows: Chukchi_$month_$era_SLIE_MMM_summary.tif For example, the name Chukchi_05_2005-2014_SLIE_MMM_summary.tif indicates the file represents data for May 2005-2014.
-
This dataset consists of sea ice indicators for the Arctic based on daily sea ice concentrations derived from satellite passive microwave measurements. The four indicators available are day of break-up start, day of break-up end, day of freeze-up start, and day of freeze-up end. These “day of year” values indicate the ordinal day of the ice-year on which the event occurred. The ice-year is defined as September 1 through August of the following year. Locally defined indicators can serve as key links between pan-Arctic or global indicators such as sea-ice extent or volume and local uses of sea ice, with the potential to inform community-scale adaptation and response.