 SNAP GeoNetwork
12 km
Type of resources
Topics
Keywords
Contact for the resource
Provided by
Formats
Representation types
Update frequencies
status
Resolution
-
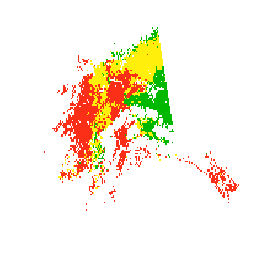
This dataset is the product of a climate-driven model of beetle survival and reproduction in Alaska. We used that model to create this dataset of landscape-level “risk” of the climatic component of beetle infestation across the forested areas of Alaska. This risk component can best be applied as protection of the landscape offered by the climate and is categorized as high, medium, and low. It does not consider other major factors, such as existing beetle and predator populations or forest susceptibility. We computed these values over one historical period (1988-2017) using the NCAR Daymet model, and three future periods (2010-2039, 2040-2069, 2070-2099) using four statistically downscaled global climate model projections, each run under two plausible greenhouse gas futures (RCP 4.5 and 8.5).
-

This dataset includes 42,120 GeoTIFFs (spatial resolution: 12 km) that represent decadal (15 decades between 1950-2099) means of monthly summaries of the following variables (units, abbreviations and case match those used in the source daily resolution dataset). There are three distinct groups of variables: Meteorological, Water State, and Water Flux. Meteorological Variables - tmax (Maximum daily 2-m air temperature, °C) - tmin (Minimum daily 2-m air temperature, °C) - pcp (Daily precipitation, mm per day) Water State Variables - SWE (Snow water equivalent, mm) - IWE (Ice water equivalent, mm) - SM1 (Soil moisture layer 1: surface to 0.02 m depth, mm) - SM2 (Soil moisture layer 2: 0.02 m to 0.97 m depth, mm) - SM3 (Soil moisture layer 3: 0.97 m to 3.0 m depth, mm) Water Flux Variables - RUNOFF (Surface runoff, mm per day) - EVAP (Actual evapotranspiration, mm per day) - SNOW_MELT (Snow melt, mm per day) - GLACIER_MELT (Ice melt, mm per day) Monthly summary functions, or how the daily frequency source data are condensed into a single monthly value, are as follows: - Sum: pcp, SNOW_MELT, EVAP, GLACIER_MELT, RUNOFF - Mean: tmin, tmax, SM1, SM2, SM3 - Maximum: IWE, SWE The model-scenario combinations used to represent various plausible climate futures are: - ACCESS1-3, RCP 4.5 - ACCESS1-3, RCP 8.5 - CanESM2, RCP 4.5 - CanESM2, RCP 8.5 - CCSM4, RCP 4.5 - CCSM4, RCP 8.5 - CSIRO-Mk3-6-0, RCP 4.5 - CSIRO-Mk3-6-0, RCP 8.5 - GFDL-ESM2M, RCP 4.5 - GFDL-ESM2M, RCP 8.5 - HadGEM2-ES, RCP 4.5 - HadGEM2-ES, RCP 8.5 - inmcm4, RCP 4.5 - inmcm4, RCP 8.5 - MIROC5, RCP 4.5 - MIROC5, RCP 8.5 - MPI-ESM-MR, RCP 4.5 - MPI-ESM-MR, RCP 8.5 - MRI-CGCM3, RCP 4.5 - MRI-CGCM3, RCP 8.5 The .zip files that are available for download are organized by variable. One .zip file has all the models and scenarios and decades and months for that variable. Each GeoTIFF file has a naming convention like this: {climate variable}_{units}_{model}_{scenario}_{month abbreviation}_{summary function}_{decade start}-{decade end}_mean.tif Each GeoTIFF has a 12 km by 12 km pixel size, and is projected to EPSG:3338 (Alaska Albers).
-

This dataset contains climate "indicators" (also referred to as climate indices or metrics) computed over one historical period (1980-2009) using the NCAR Daymet dataset, and two future periods (2040-2069, 2070-2099) using two statistically downscaled global climate model projections, each run under two plausible greenhouse gas futures (RCP 4.5 and 8.5). The indicators within this dataset include: hd: “Hot day” threshold -- the highest observed daily maximum 2 m air temperature such that there are 5 other observations equal to or greater than this value. cd: “Cold day” threshold -- the lowest observed daily minimum 2 m air temperature such that there are 5 other observations equal to or less than this value. rx1day: Maximum 1-day precipitation su: "Summer Days" –- Annual number of days with maximum 2 m air temperature above 25 C dw: "Deep Winter days" –- Annual number of days with minimum 2 m air temperature below -30 C wsdi: Warm Spell Duration Index -- Annual count of occurrences of at least 5 consecutive days with daily mean 2 m air temperature above 90th percentile of historical values for the date cdsi: Cold Spell Duration Index -- Same as WDSI, but for daily mean 2 m air temperature below 10th percentile rx5day: Maximum 5-day precipitation r10mm: Number of days with precipitation > 10 mm cwd: Consecutive wet days –- number of the most consecutive days with precipitation > 1 mm cdd: Consecutive dry days –- number of the most consecutive days with precipitation < 1 mm
-

This dataset consists of four different variables: degree days below 65°F (or "heating degree days"), degree days below 0°F, degree days below 32°F (or "air freezing index"), and degree days above 32°F (or "air thawing index"). All were derived from the same set of nine statistically downscaled CMIP5 global climate model outputs driven by RCP 4.5 and RCP 8.5 emissions scenarios. A historical baseline (Daymet, 1980-2017) dataset is included for each variable. All data are in GeoTIFF format and have a spatial resolution of 12 km. Units are degree days Fahrenheit (°F⋅days). The model-scenario combinations are: - ACCESS1-3, RCP 4.5 - ACCESS1-3, RCP 8.5 - CanESM2, RCP 4.5 - CanESM2, RCP 8.5 - CCSM4, RCP 4.5 - CCSM4, RCP 8.5 - CSIRO-Mk3-6-0, RCP 4.5 - CSIRO-Mk3-6-0, RCP 8.5 - GFDL-ESM2M, RCP 4.5 - GFDL-ESM2M, RCP 8.5 - inmcm4, RCP 4.5 - inmcm4, RCP 8.5 - MIROC5, RCP 4.5 - MIROC5, RCP 8.5 - MPI-ESM-MR, RCP 4.5 - MPI-ESM-MR, RCP 8.5 - MRI-CGCM3, RCP 4.5 - MRI-CGCM3, RCP 8.5 The .zip files that are available for download are organized by variable. One .zip file has all the models and scenarios and years for that variable. Each GeoTIFF file has a naming convention like this: "ncar_12km_{model}_{scenario}_{variable}_{year}_Fdays.tif" Each GeoTIFF has a 12 km by 12 km pixel size, and is projected to EPSG:3338 (Alaska Albers).