 SNAP GeoNetwork
771 m
Type of resources
Topics
Keywords
Contact for the resource
Provided by
Years
Formats
Representation types
Update frequencies
status
Resolution
-
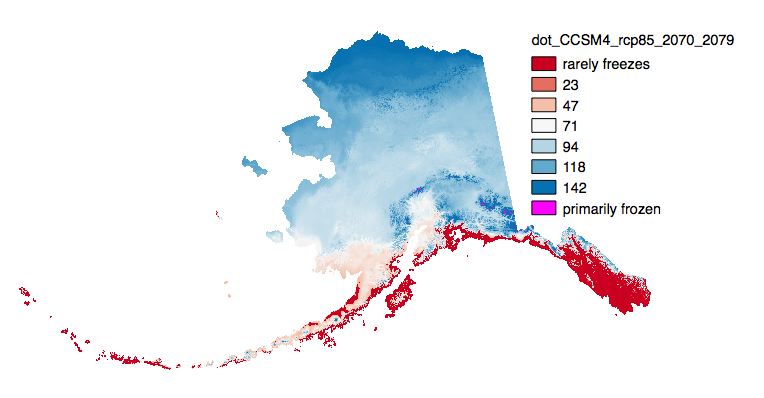
This set of files includes downscaled projections of decadal means of annual day of freeze or thaw (ordinal day of the year), and length of growing season (numbers of days, 0-365) for each decade from 2010 - 2100 at 771x771 meter spatial resolution. Each file represents a decadal mean of an annual mean calculated from mean monthly data. ---- The spatial extent includes Alaska. Each set of files originates from one of five top ranked global circulation models from the CMIP5/AR5 models and RPCs, or is calculated as a 5 Model Average. Day of Freeze, Day of Thaw, Length of Growing Season calculations: Estimated ordinal days of freeze and thaw are calculated by assuming a linear change in temperature between consecutive months. Mean monthly temperatures are used to represent daily temperature on the 15th day of each month. When consecutive monthly midpoints have opposite sign temperatures, the day of transition (freeze or thaw) is the day between them on which temperature crosses zero degrees C. The length of growing season refers to the number of days between the days of thaw and freeze. This amounts to connecting temperature values (y-axis) for each month (x-axis) by line segments and solving for the x-intercepts. Calculating a day of freeze or thaw is simple. However, transitions may occur several times in a year, or not at all. The choice of transition points to use as the thaw and freeze dates which best represent realistic bounds on a growing season is more complex. Rather than iteratively looping over months one at a time, searching from January forward to determine thaw day and from December backward to determine freeze day, stopping as soon as a sign change between two months is identified, the algorithm looks at a snapshot of the signs of all twelve mean monthly temperatures at once, which enables identification of multiple discrete periods of positive and negative temperatures. As a result more realistic days of freeze and thaw and length of growing season can be calculated when there are idiosyncrasies in the data.
-
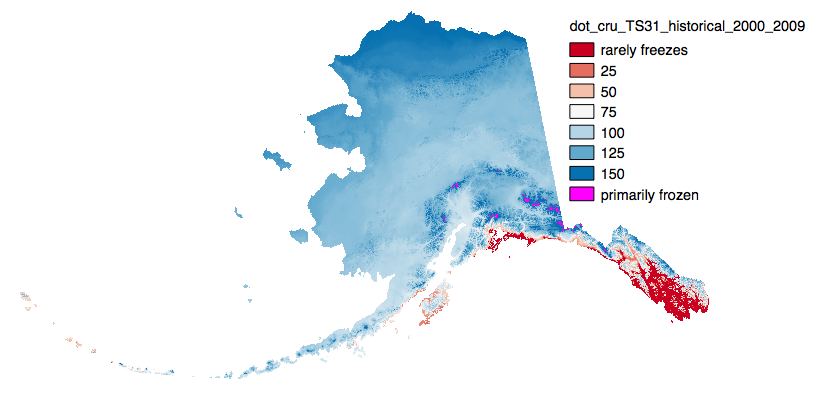
This set of files includes downscaled historical estimates of decadal means of annual day of freeze or thaw (ordinal day of the year), and length of growing season (numbers of days, 0-365) for each decade from 1910 - 2006 (CRU TS 3.0) or 2009 (CRU TS 3.1) at at 771 x 771 meter spatial resolution. Each file represents a decadal mean of an annual mean calculated from mean monthly data.
-
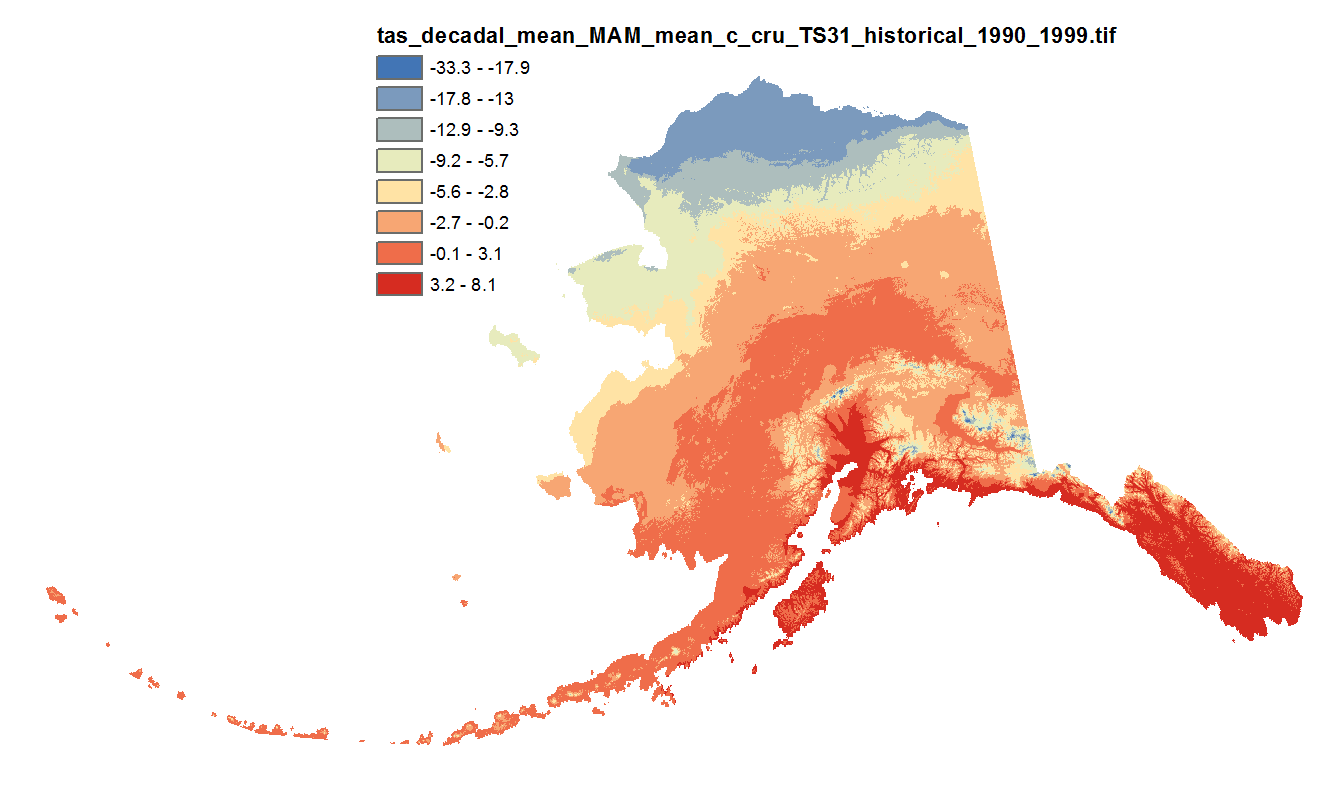
This set of files includes downscaled projections of monthly totals, and derived annual, seasonal, and decadal means of monthly average temperature (in degrees Celsius, no unit conversion necessary) from 1901 - 2006 (CRU TS 3.0) or 2009 (CRU TS 3.1) at 771 x 771 meter spatial resolution.
-

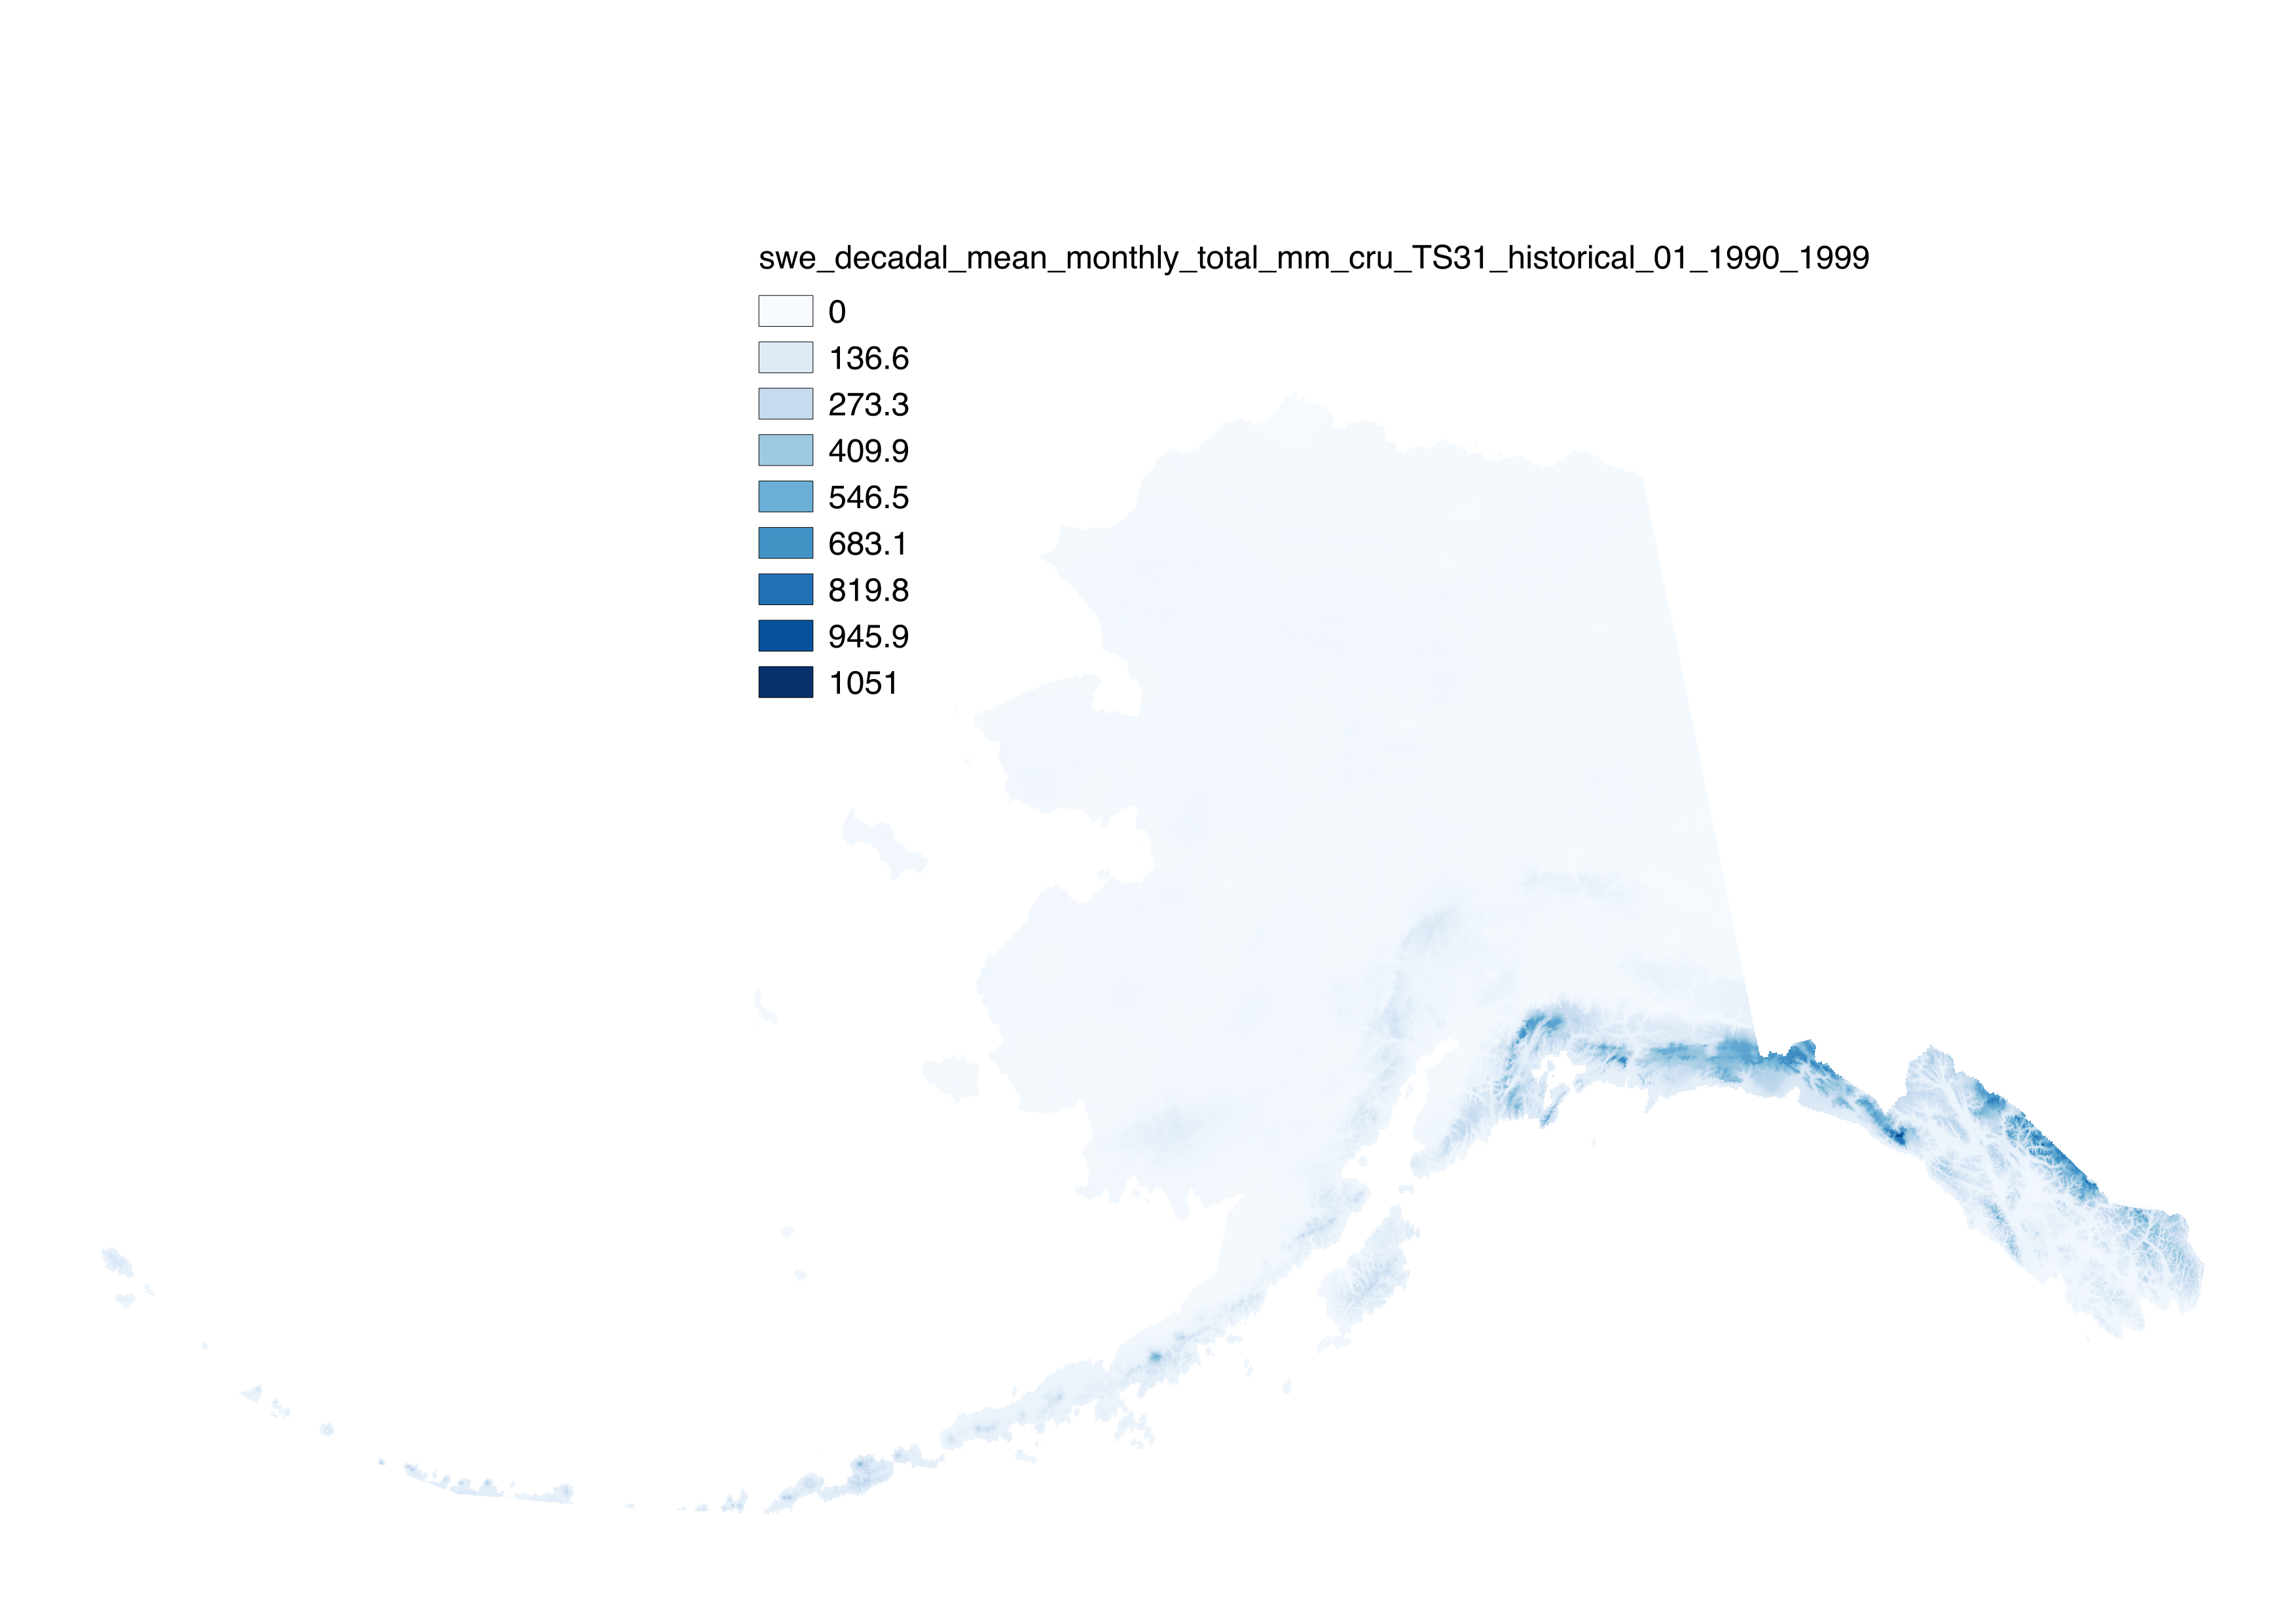
These files include downscaled historical decadal average monthly snowfall equivalent ("SWE", in millimeters) for each month at 771 x 771 m spatial resolution. Each file represents a decadal average monthly mean. Historical data for 1910-1919 to 1990-1999 are available for CRU TS3.0-based data and for 1910-1919 to 2000-2009 for CRU TS3.1-based data.
-
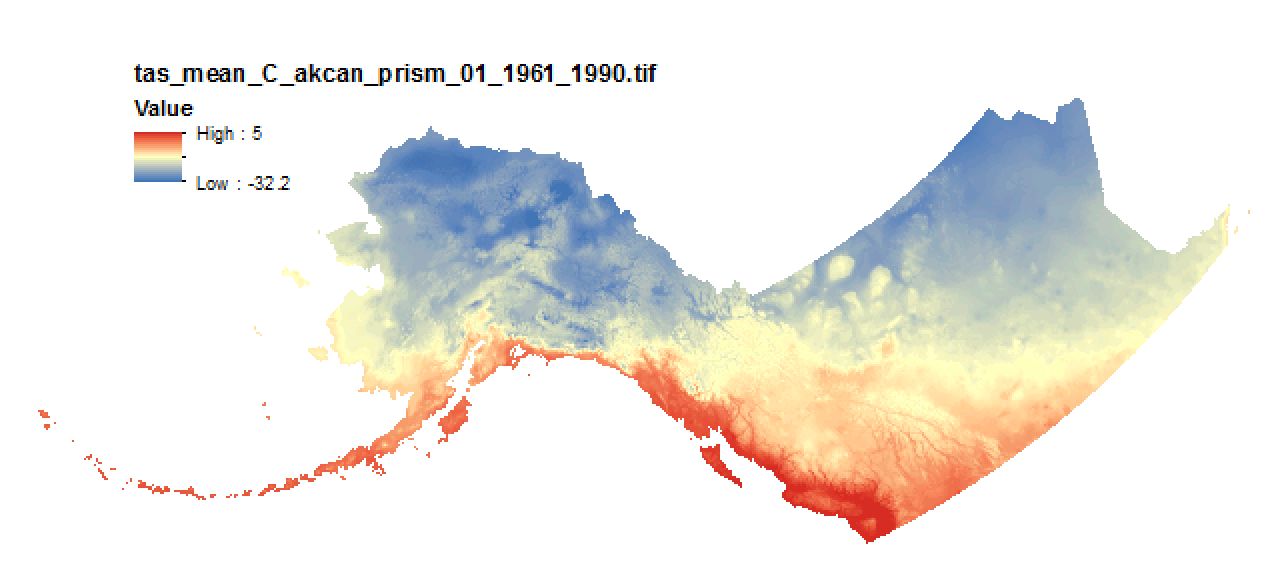
This data set consists of PRSIM mean air temperature climatologies for Alaska in GeoTIFF format. The files in this data set are available from the PRISM Climate Group as text files but have been processed into GeoTIFFs. These are monthly climatologies with a resolution of 771m. Units are degrees Celsius. There are multiple climatological periods currently available through PRISM, but only one is currently available through SNAP in this dataset: 1971-2000.
-
These files include historical downscaled estimates of decadal average monthly snow-day fraction ("fs", units = percent probability from 1 – 100) for each month of the decades from 1900-1909 to 2000-2009 at 771 x 771 m spatial resolution. Each file represents a decadal average monthly mean. Version 1.0 was completed in 2015 using CMIP3. Version 2.0 was completed in 2018 using CMIP5. For more information on the methodology used to create this dataset, and guidelines for appropriate usage of the dataset, please see the data user's guide here: http://data.snap.uaf.edu/data/Base/AK_771m/historical/CRU_TS/snow_day_fraction/snow_fraction_data_users_guide.pdf
-
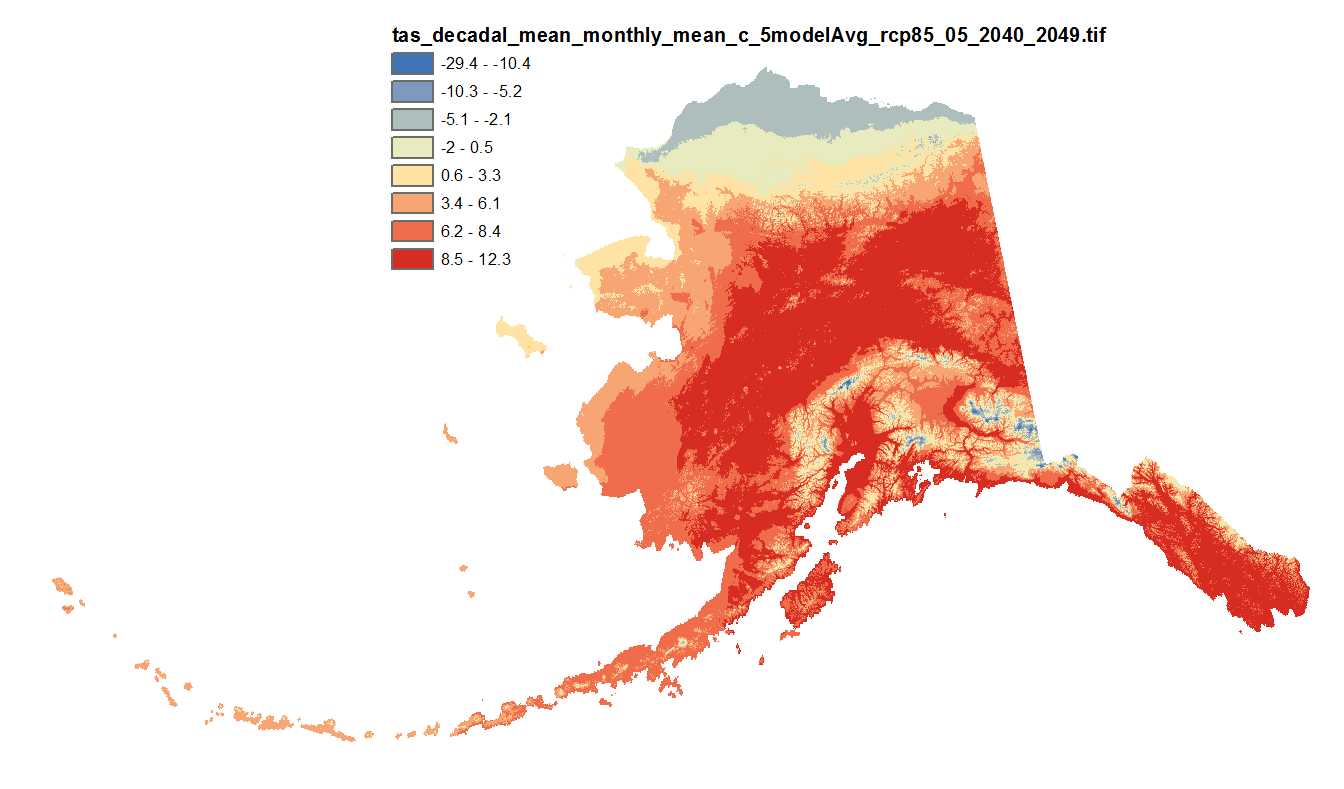
This set of files includes downscaled projections of monthly means, and derived annual, seasonal, and decadal means of monthly mean temperatures (in degrees Celsius, no unit conversion necessary) from Jan 2006 - Dec 2100 at 771x771 meter spatial resolution. For seasonal means, the four seasons are referred to by the first letter of 3 months making up that season: * `JJA`: summer (June, July, August) * `SON`: fall (September, October, November) * `DJF`: winter (December, January, February) * `MAM`: spring (March, April, May) The downscaling process utilizes PRISM climatological datasets from 1971-2000. Each set of files originates from one of five top-ranked global circulation models from the CMIP5/AR5 models and RCPs or is calculated as a 5 Model Average.
-
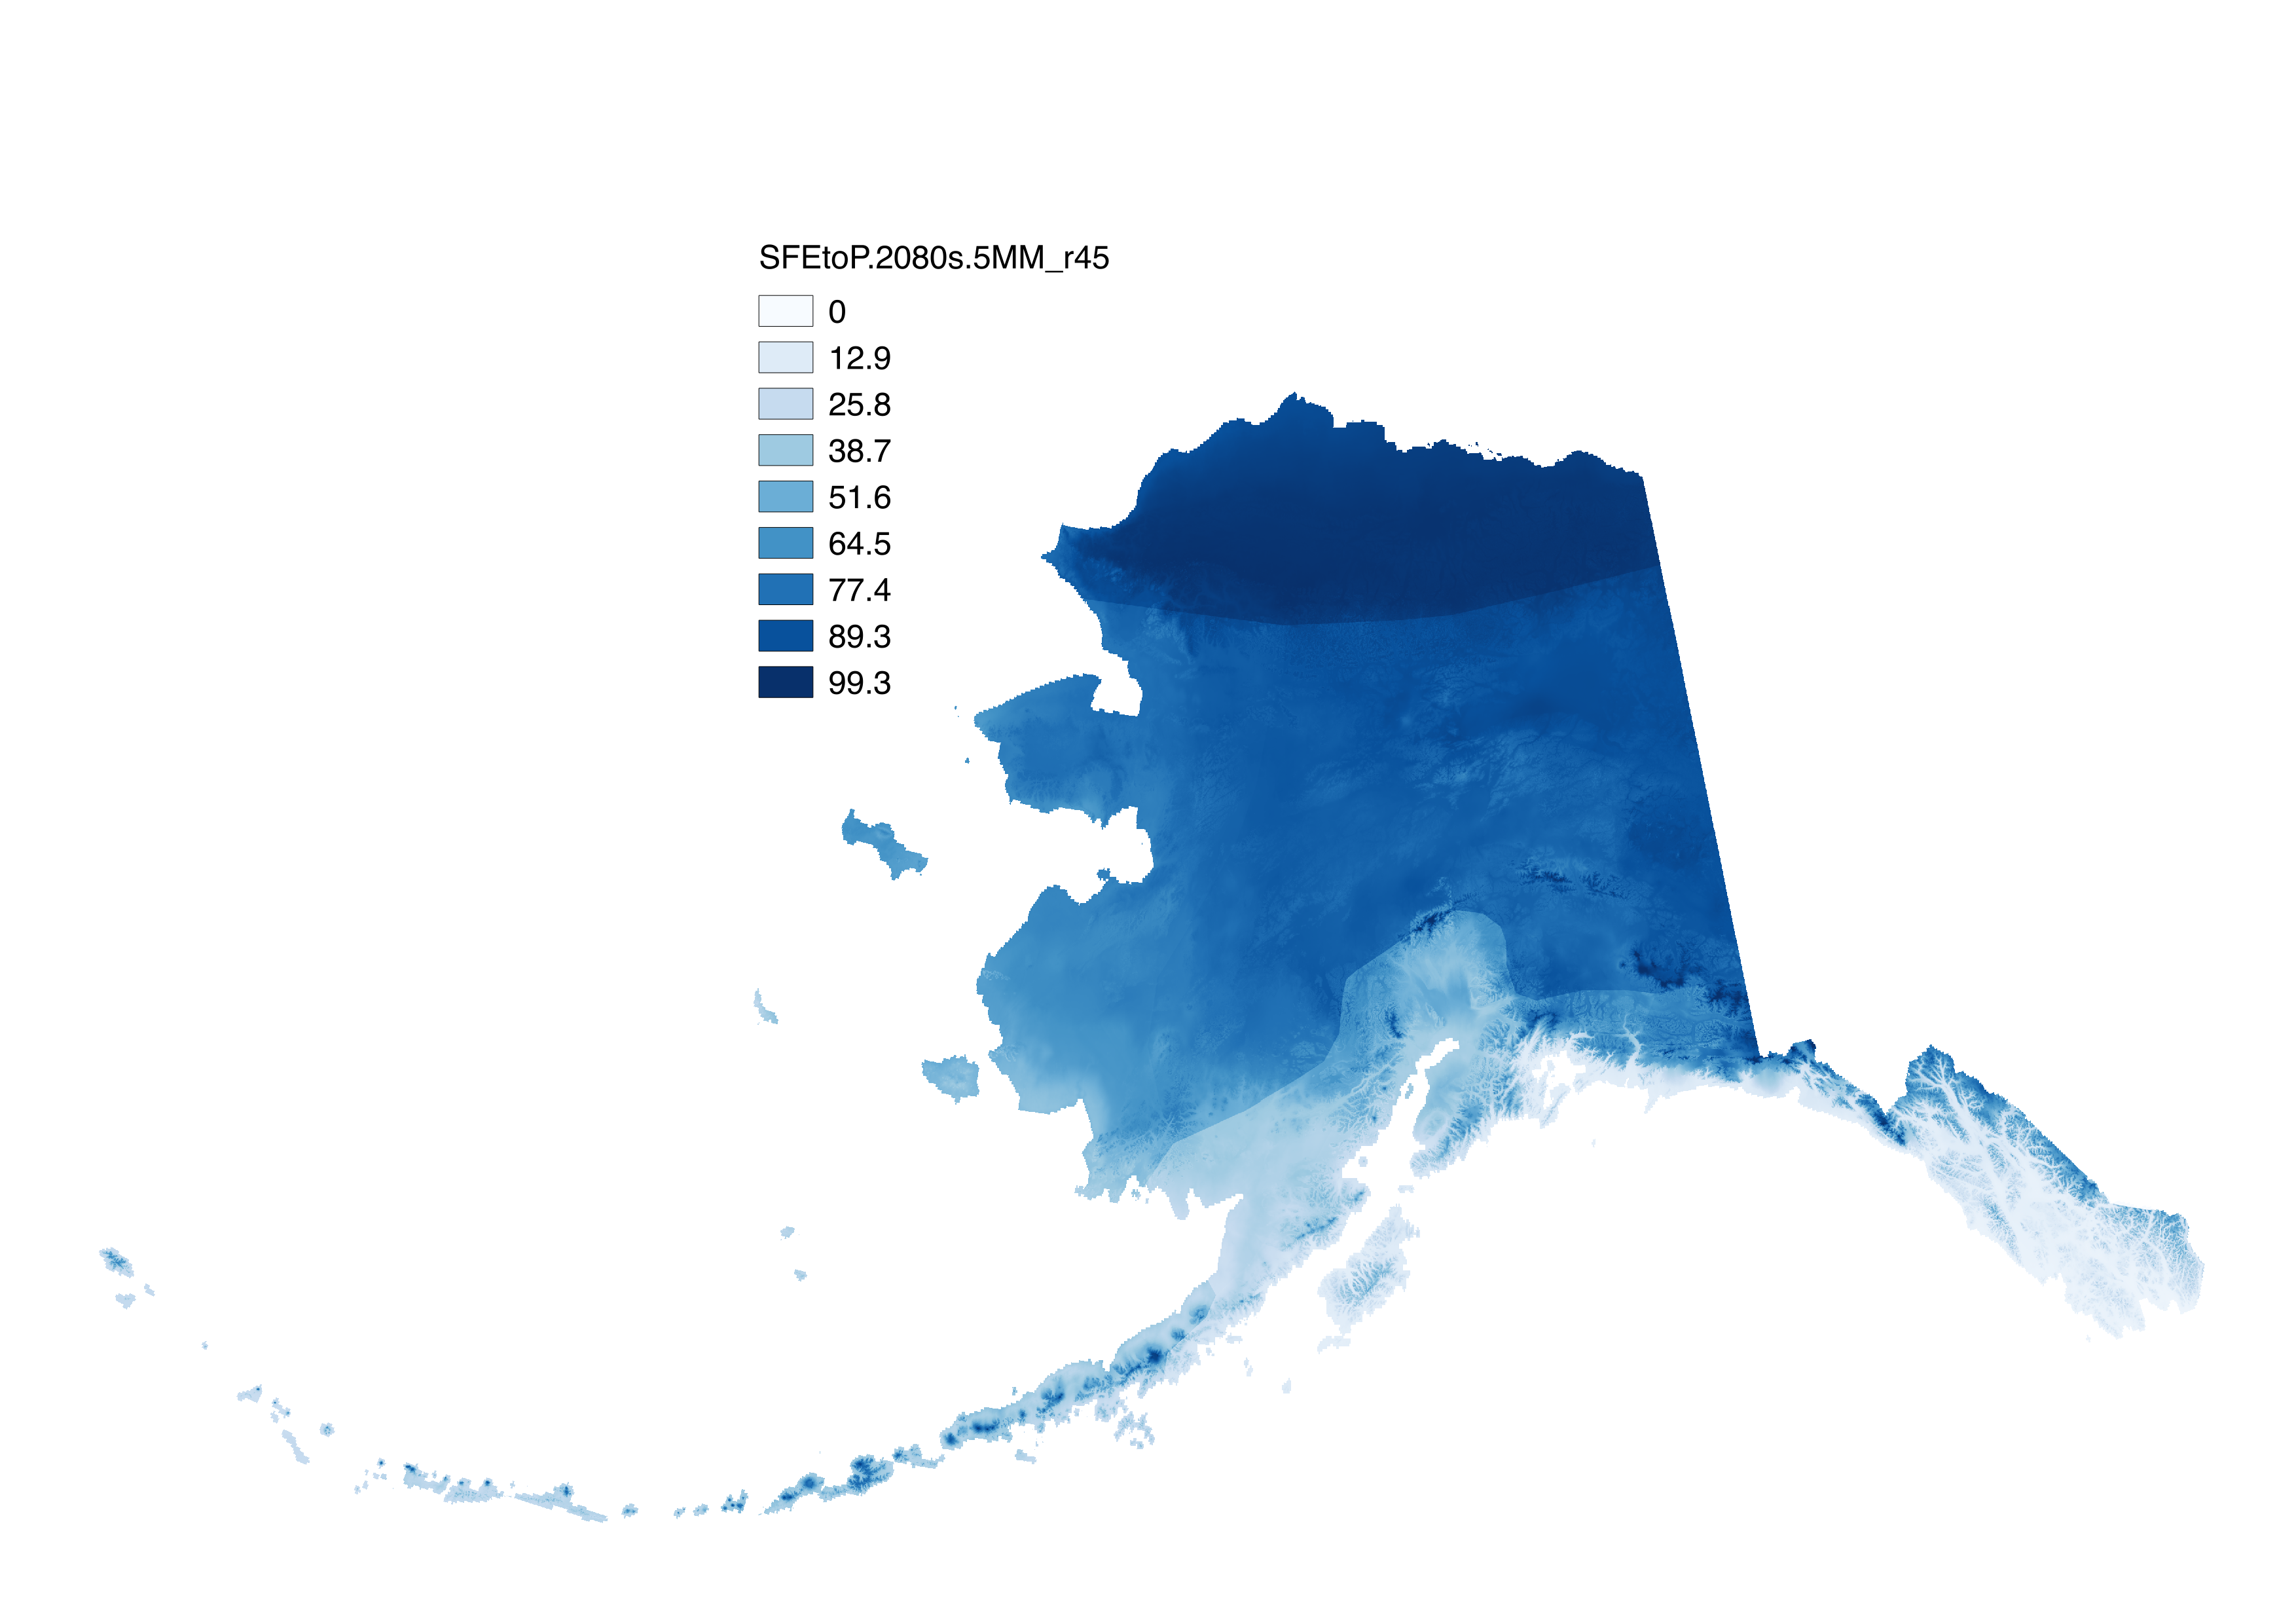
These files include climatological summaries of downscaled historical and projected decadal average monthly snowfall (i.e. snow-water) equivalent (SWE) in millimeters, the ratio of snowfall equivalent to precipitation, and future change in snowfall for October-March at 771-meter spatial resolution across the state of Alaska. Data are for summary October to March Alaska climatologies for: 1) historical and future snowfall equivalent (SWE), produced by multiplying snow-day fraction by decadal average monthly precipitation and summing over 6 months from October to March to estimate the total SWE on April 1. 2) historical and future ratio of SWE to precipitation (SFEtoP), SFEtoP is the ratio of October to March total SWE to October to March total precipitation is calculated as total SWE / total precipitation (expressed as percent, 0-100). 3) future change in snowfall equivalent relative to historical ("dSWE"), calculated as (SWE future – SWE historical) / SWE historical (no units, multiply by 100 to obtain percent). The historical reference period is 1970-1999, (file name “H70.99”), calculated from downscaled CRU TS 3.1 data Future climatologies (both RCP 4.5 and 8.5) are for: - 2020s (2010-2039) - 2050s (2040-2069) - 2080s (2070-2099) across 5 GCMs: NCAR-CCSM4, GFDL-CM3, GISS-E2-R, IPSL-CM5, and MRI-CGCM3 as well as a 5-model mean (“5MM”). Following Elsner et al. (2010), <0.1 is rain dominated, 0.1 < SFE:P < 0.4 is transitional, and >0.4 is snow dominated. Only calculated for historical reference climatology 1970-1999 and three future climatologies: 2010-2039, 2040-2069, and 2070-2090, with each climatology representing the mean of three decadal averages from the available decadal grids. Snow fraction data used can be found here: http://ckan.snap.uaf.edu/dataset/projected-decadal-averages-of-monthly-snow-day-fraction-771m-cmip5-ar5 http://ckan.snap.uaf.edu/dataset/historical-decadal-averages-of-monthly-snow-day-fraction-771m-cru-ts3-0-3-1 Precipitation data used can be found here: http://ckan.snap.uaf.edu/dataset/projected-monthly-and-derived-precipitation-products-771m-cmip5-ar5 http://ckan.snap.uaf.edu/dataset/historical-monthly-and-derived-precipitation-products-771m-cru-ts * Note: In Littell et al. 2018, "SWE" is referred to as "SFE", and "SFEtoP" as "SFE:P"
-
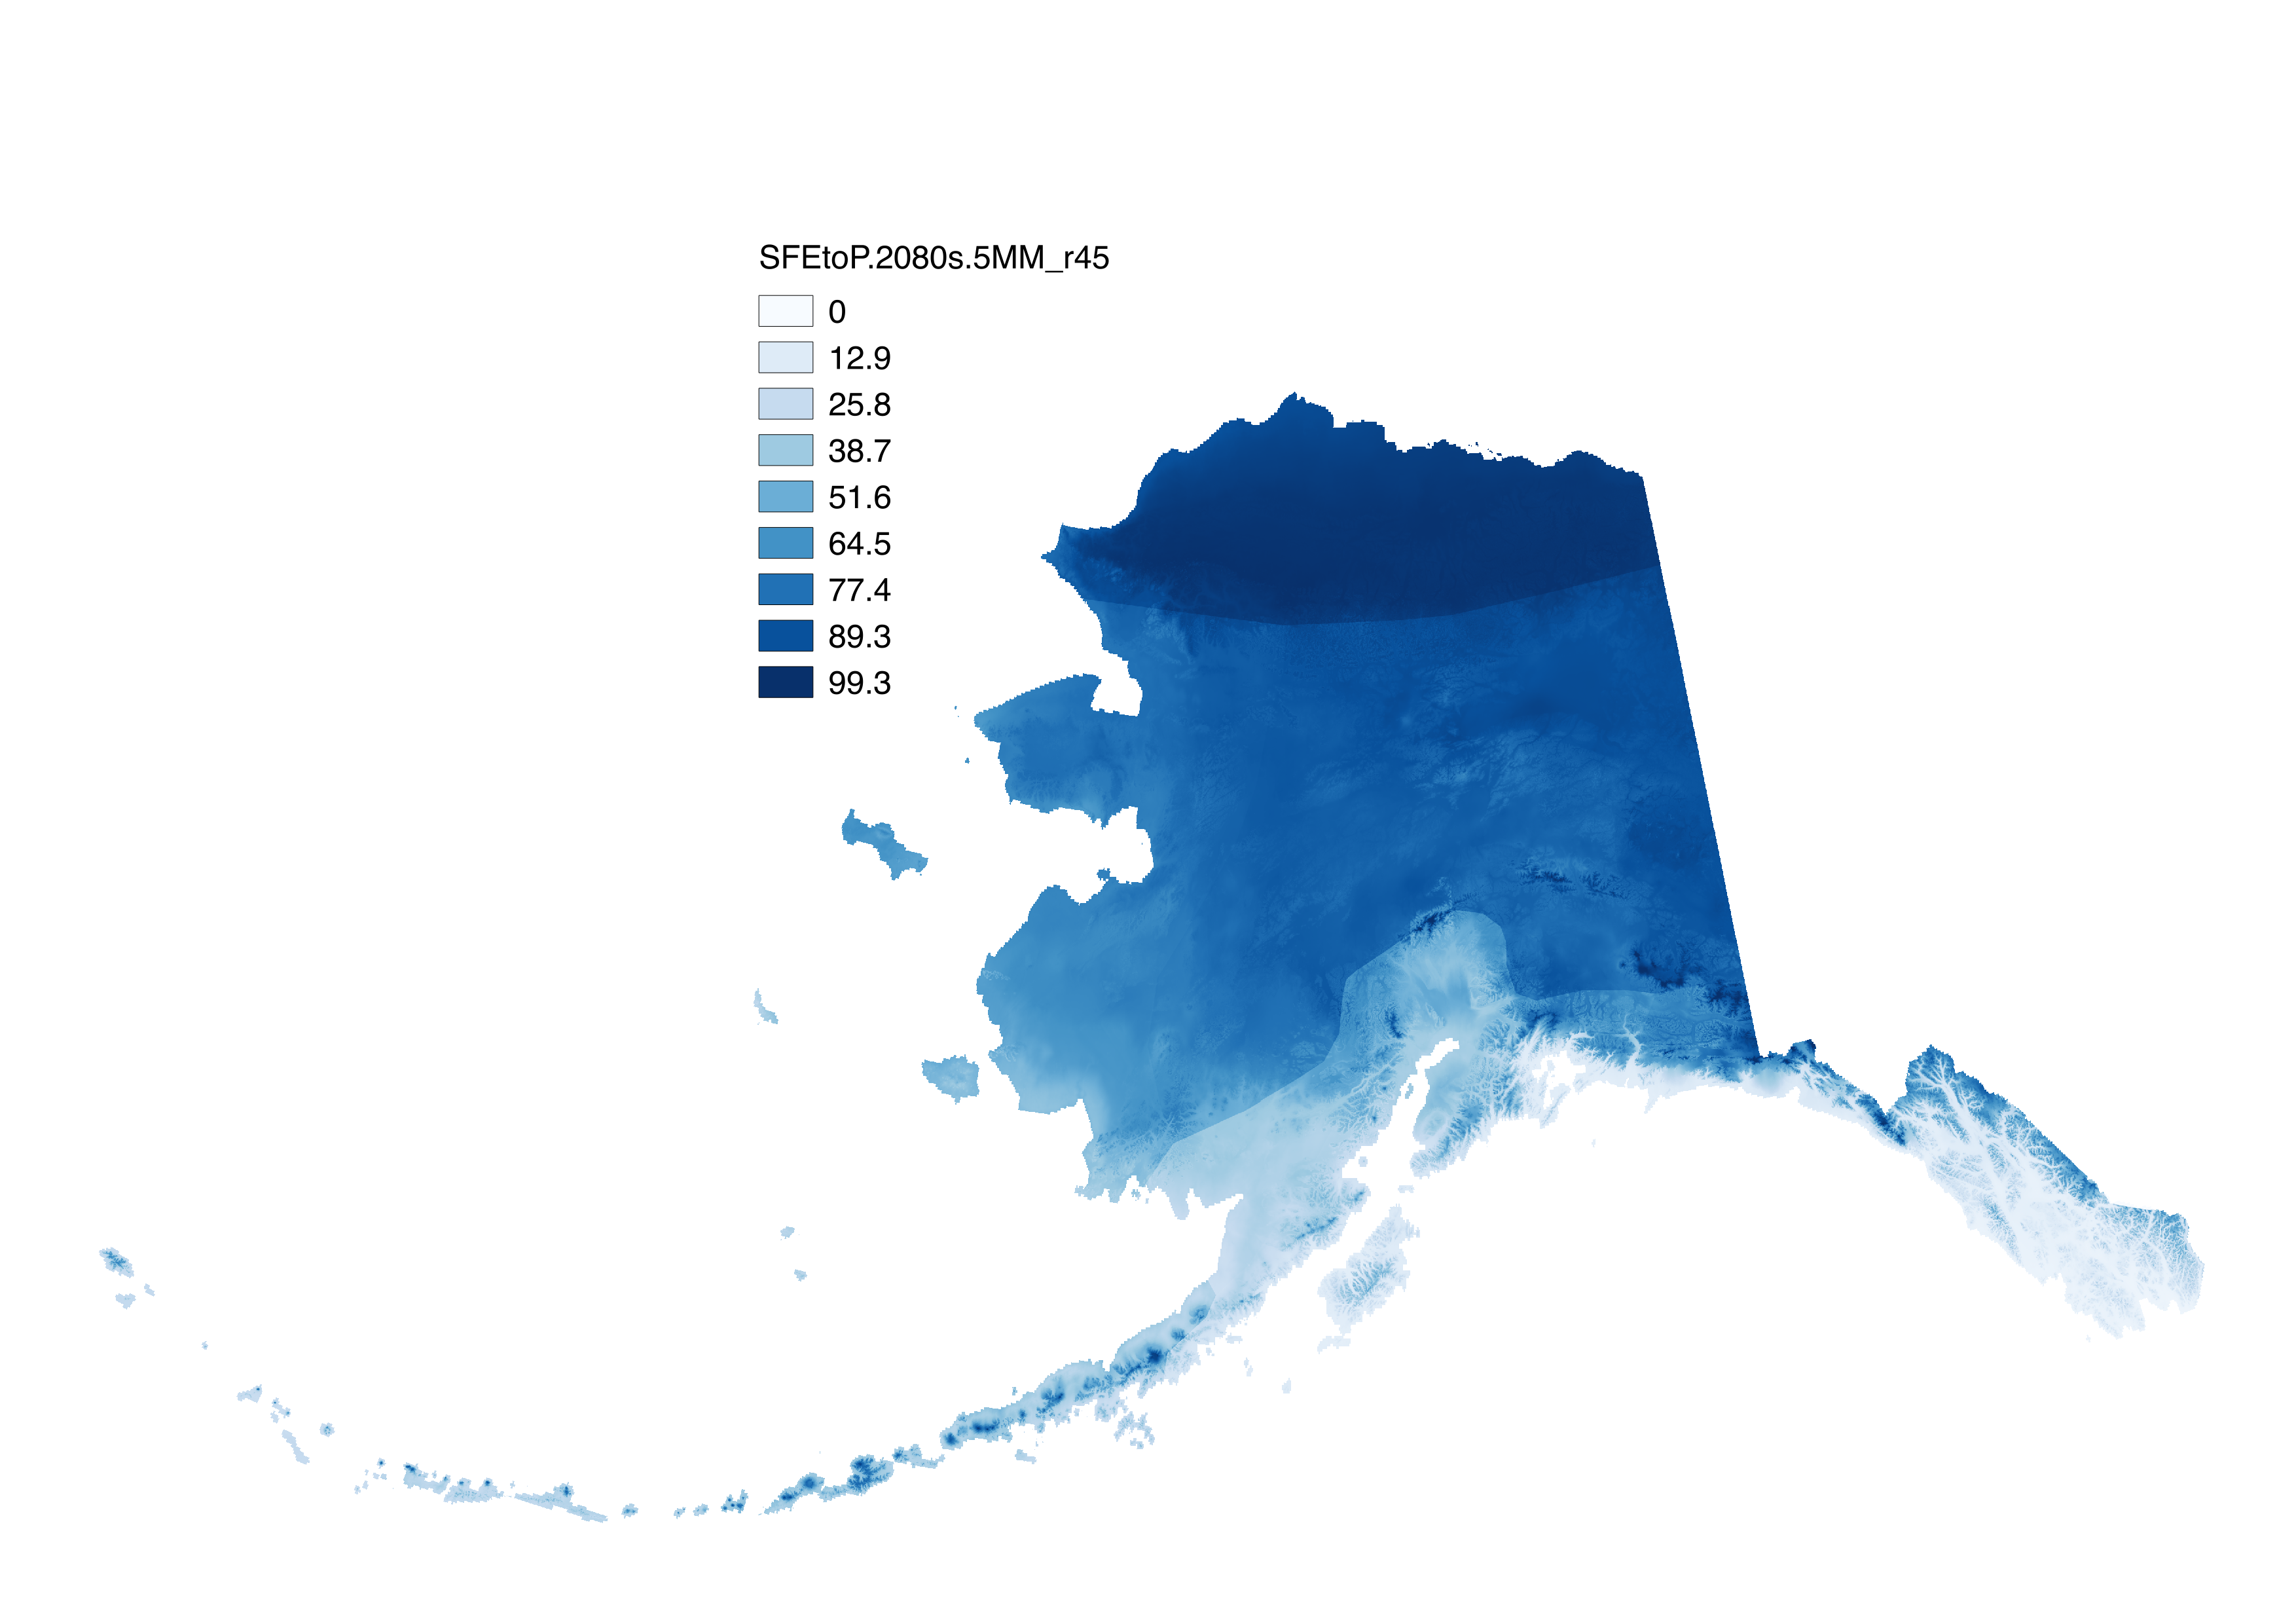
These files include climatological summaries of downscaled historical and projected decadal average monthly derived snow variables and summaries at 771 meter spatial resolution across Alaska. There are three types of files: 1). The historical and future snowfall water equivalent (SWE) in millimeters, produced by multiplying snow-day fraction by decadal average monthly precipitation and summing over 6 months from October to March to estimate the total SWE on April 1. 2). The historical and future ratio of SWE to total precipitation (SFEtoP) in percent. SFEtoP is calculated as (SWE / total precipitation) and also represents the six month October to March period. 3). The future difference in SWE with respect to the historical baseline (dSWE) in percent. dSWE is calculated as ((future SWE – historical SWE) / historical SWE) * 100. These data are also summary for the six month October to March period. The historical baseline period is 1970-1999, (file naming convention “H70.99”) and data are calculated from downscaled CRU TS 3.1 data. Projected variables exist for RCP 4.5 and RCP 8.5 emission scenarios and for 5 GCMs: NCAR-CCSM4, GFDL-CM3, GISS-E2-R, IPSL-CM5, and MRI-CGCM3. The 5-model mean (file naming convention "5MM") was also computed. Projections exist for three thirty-year climatologies: the 2020s (2010-2039), the 2050s (2040-2069), and the 2080s (2070-2099). The snow-day fraction data used can be found here: http://ckan.snap.uaf.edu/dataset/projected-decadal-averages-of-monthly-snow-day-fraction-771m-cmip5-ar5 http://ckan.snap.uaf.edu/dataset/historical-decadal-averages-of-monthly-snow-day-fraction-771m-cru-ts3-0-3-1 The precipitation data used can be found here: http://ckan.snap.uaf.edu/dataset/projected-monthly-and-derived-precipitation-products-771m-cmip5-ar5 http://ckan.snap.uaf.edu/dataset/historical-monthly-and-derived-precipitation-products-771m-cru-ts Note: In Littell et al. 2018, "SWE" is referred to as "SFE", and "SFEtoP" as "SFE:P"
-
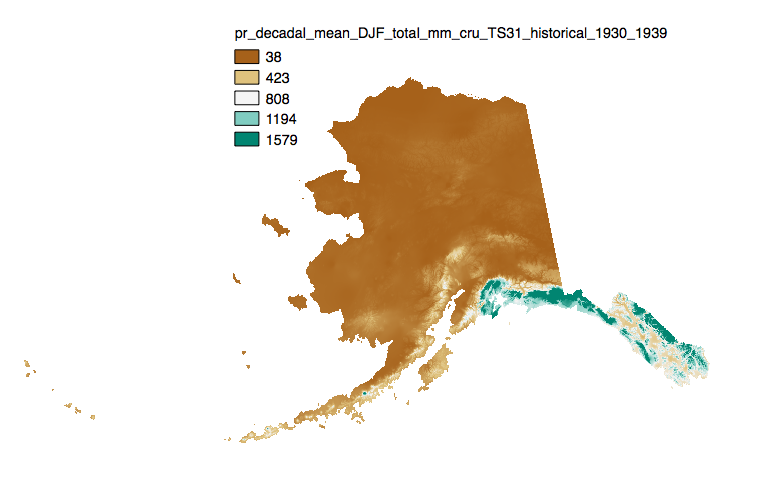
This set of files includes downscaled historical estimates of monthly totals, and derived annual, seasonal, and decadal means of monthly total precipitation (in millimeters, no unit conversion necessary) from 1901 - 2006 (CRU TS 3.0) or 2009 (CRU TS 3.1) at 771 x 771 meter spatial resolution.