 SNAP GeoNetwork
Climatology, meteorology, atmosphere
Type of resources
Topics
Keywords
Contact for the resource
Provided by
Years
Formats
Representation types
Update frequencies
status
Scale
Resolution
-
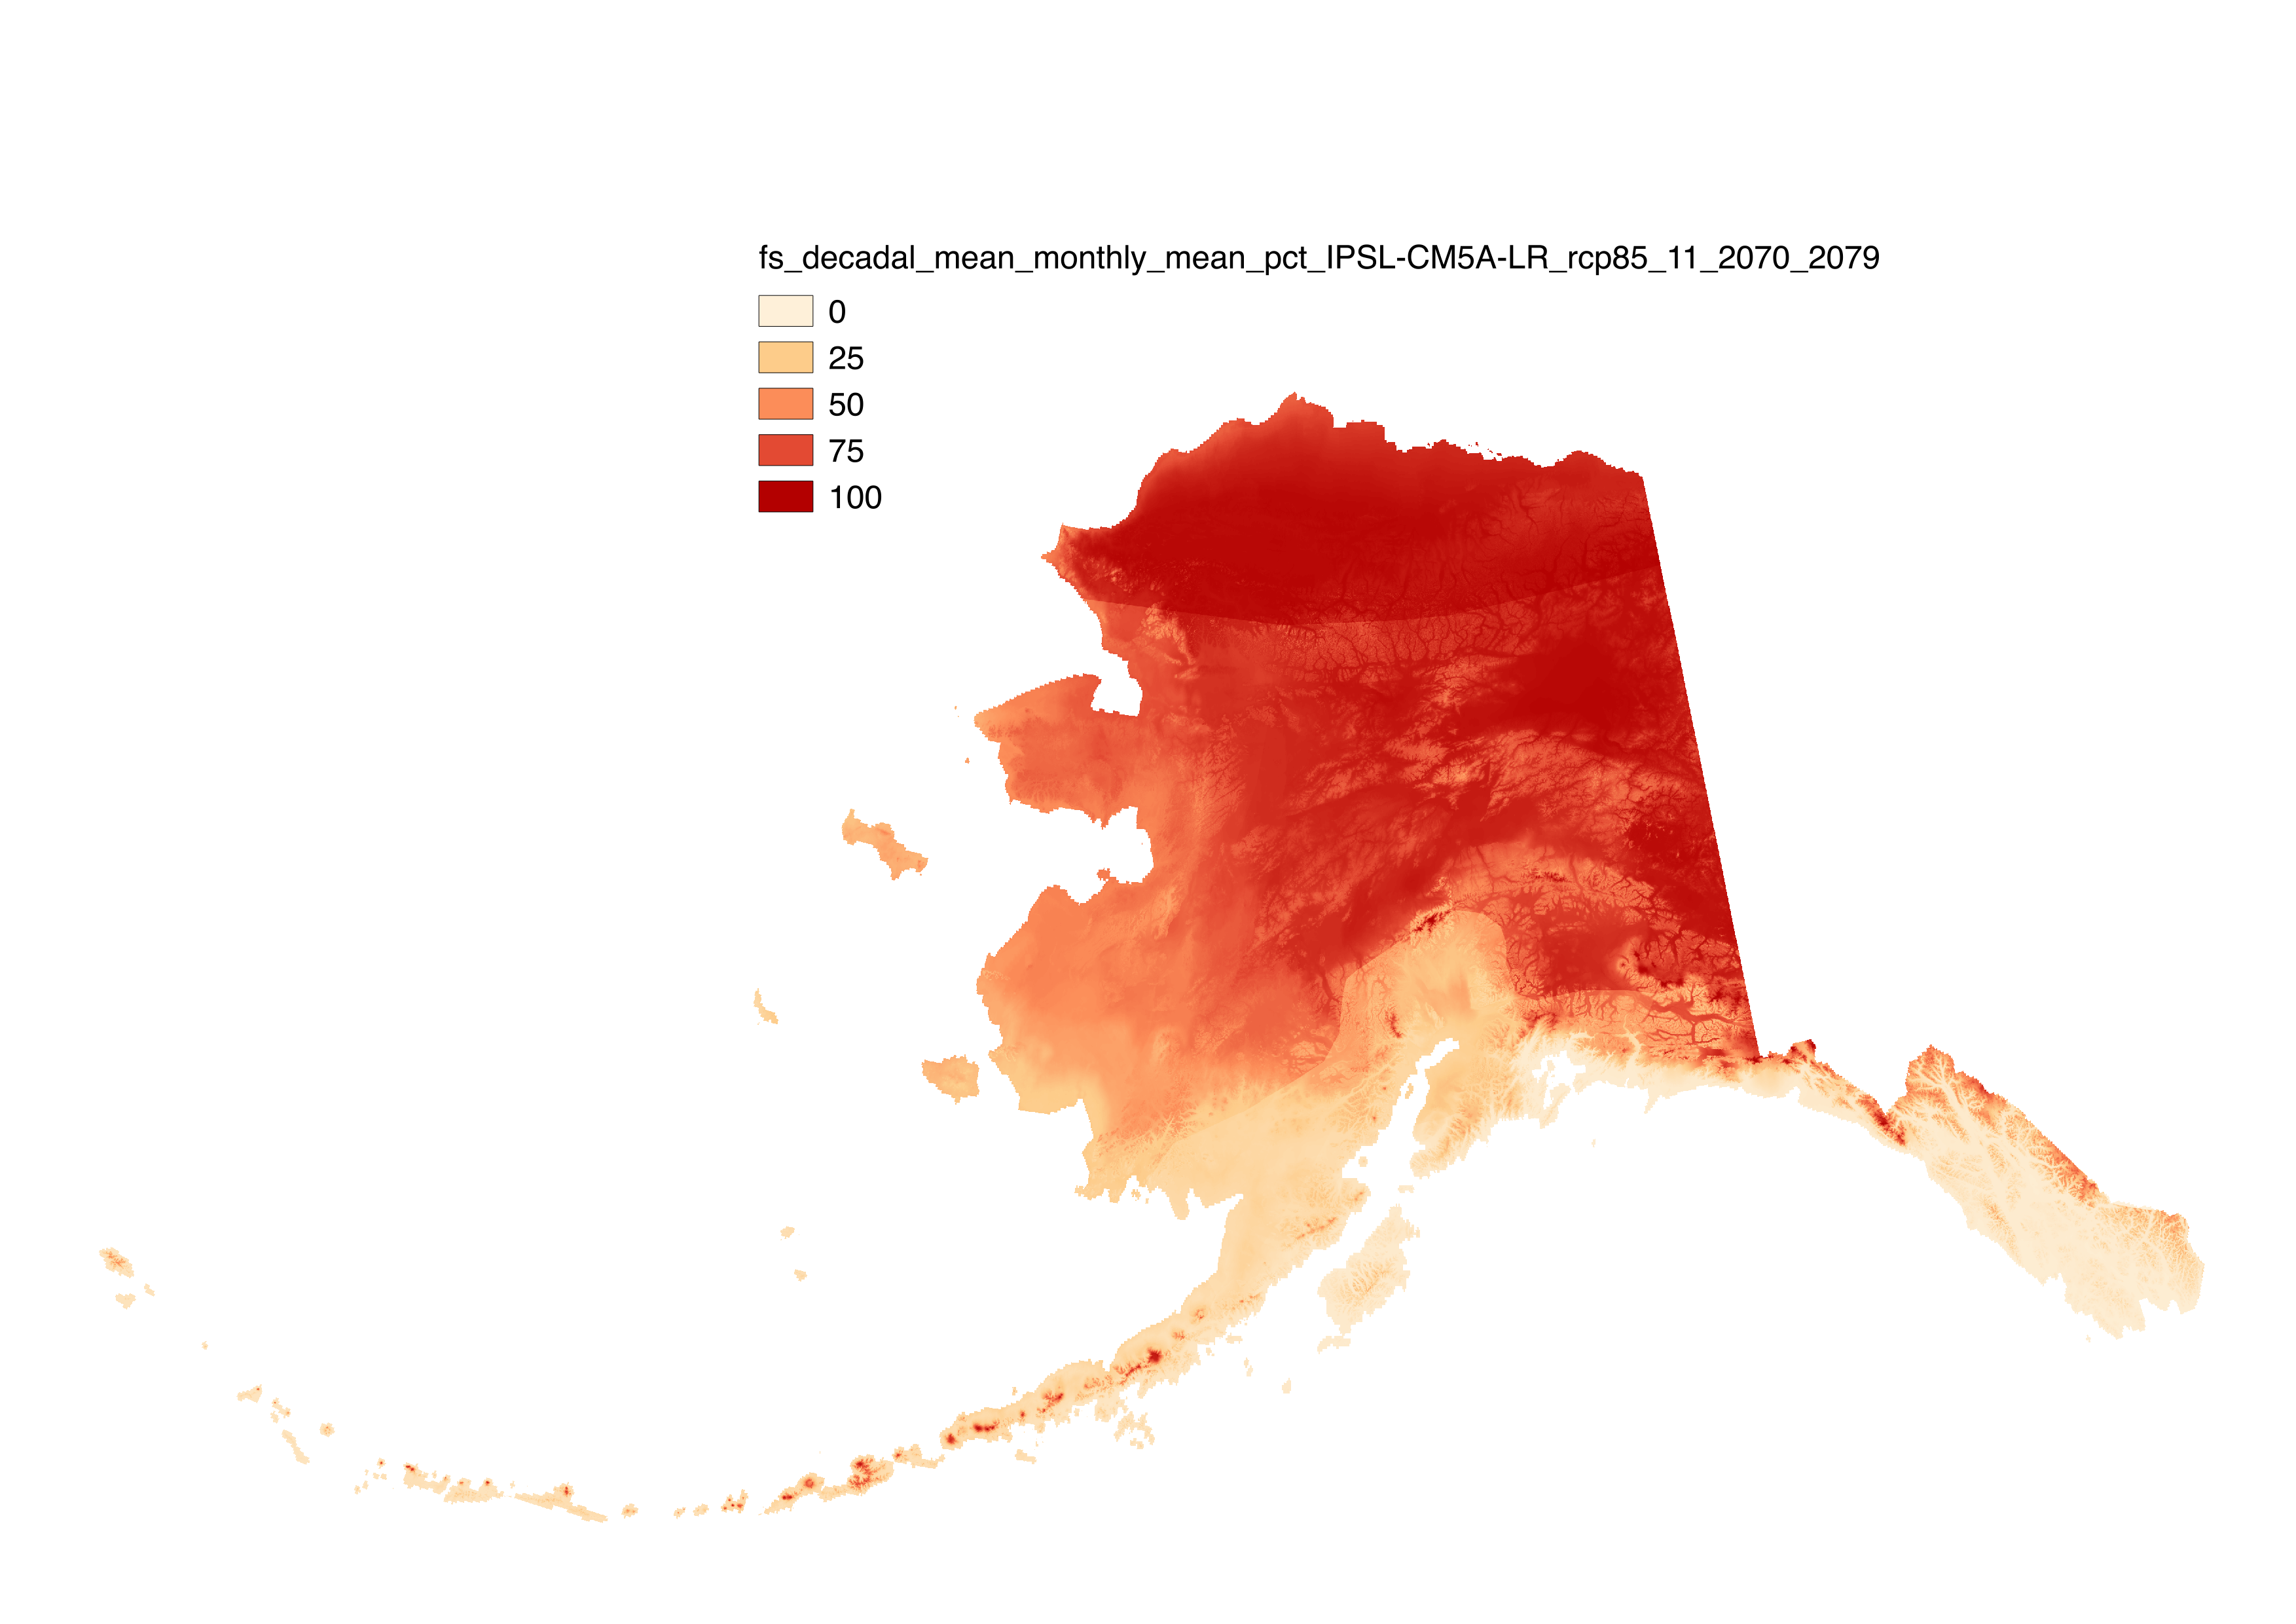
These files include downscaled projections of decadal average monthly snow-day fraction ("fs", units = percent probability from 1 – 100) for each month of the decades from 2010-2019 to 2090-2099 at 771 x 771 m spatial resolution. Each file represents a decadal average monthly mean. Output is available for the CCSM4, GFDL-CM3, GISS-E2-R, IPSL-CM5A-LR, and MRI-CGCM3 models and three emissions scenarios (RCP 4.5, RCP 6.0 and RCP 8.5). These snow-day fraction estimates were produced by applying equations relating decadal average monthly temperature to snow-day fraction to downscaled decadal average monthly temperature. Separate equations were used to model the relationship between decadal monthly average temperature and the fraction of wet days with snow for seven geographic regions in the state: Arctic, Western Alaska, Interior, Cook Inlet, SW Islands, SW Interior, and the Gulf of Alaska coast, using regionally specific logistic models of the probability that precipitation falls as snow given temperature based on station data fits as in McAfee et al. 2014. These projections differ from McAfee et al. 2014 in that updated CMIP5 projected temperatures rather than CMIP3 temperatures were used for the future projections. Although the equations developed here provide a reasonable fit to the data, model evaluation demonstrated that some stations are consistently less well described by regional models than others. It is unclear why this occurs, but it is likely related to localized climate conditions. Very few weather stations with long records are located above 500m elevation in Alaska, so the equations used here were developed primarily from low-elevation weather stations. It is not clear whether the equations will be completely appropriate in the mountains. Finally, these equations summarize a long-term monthly relationship between temperature and precipitation type that is the result of short-term weather variability. In using these equations to make projections of future snow, as assume that these relationships remain stable over time, and we do not know how accurate that assumption is. These snow-day fraction estimates were produced by applying equations relating decadal average monthly temperature to snow-day fraction to downscaled projected decadal average monthly temperature. The equations were developed from daily observed climate data in the Global Historical Climatology Network. These data were acquired from the National Climatic Data Center in early 2012. Equations were developed for the seven climate regions described in Perica et al. (2012). Geospatial data describing those regions was provided by Sveta Stuefer. Perica, S., D. Kane, S. Dietz, K. Maitaria, D. Martin, S. Pavlovic, I. Roy, S. Stuefer, A. Tidwell, C. Trypaluk, D. Unruh, M. Yekta, E. Betts, G. Bonnin, S. Heim, L. Hiner, E. Lilly, J. Narayanan, F.Yan, T. Zhao. 2012. NOAA Atlas 14. Precipitation-Frequency Atlas of the United States.
-
This data set consists of PRSIM precipitation climatologies for Alaska in GeoTIFF format. The files in this data set are available from the PRISM Climate Group as text files but have been processed into GeoTIFFs. These are monthly climatologies with a resolution of 771m. Units are millimeters. There are multiple climatological periods currently available through PRISM, but only one is currently available through SNAP in this dataset: 1971-2000.
-
This data set consists of PRSIM mean air temperature climatologies for Alaska in GeoTIFF format. The files in this data set are available from the PRISM Climate Group as text files but have been processed into GeoTIFFs. These are monthly climatologies with a resolution of 771m. Units are degrees Celsius. There are multiple climatological periods currently available through PRISM, but only one is currently available through SNAP in this dataset: 1971-2000.
-
Southeast Alaska is a topographically complex region that is experiencing rapid rates of change with climate regimes that range from temperate rainforest to expansive glaciers and icefields. Global climate models – with a typical spatial resolution of 100 km – poorly resolve this area, while recent downscaling efforts have sought to improve upon existing deficiencies. This research produced hourly dynamically downscaled climate model simulations at 1- and 4-km spatial resolution for both historical (1981-2019) and future periods (2031-2060) across Southeast Alaska. Particular focus was placed on three key watersheds: 1) Montana Creek near Juneau, 2) Indian River near Sitka and 3) Staney Creek on Prince of Wales Island. The projected simulations were based on the representative concentration pathway 8.5 (RCP8.5) emissions scenario. The simulations included the historical Climate Forecast System Reanalysis, and two climate models (the Community Climate System Model, version 4 and the Geophysical Fluid Dynamics Laboratory Climate Model, version 3), which were both run for historical and future periods. All downscaling simulations were run using a 17-month spin-up period to sufficiently generate the land surface state and the lateral boundary conditions for each were updated every 6 hours to constrain the output. The downscaling was completed using the Weather and Research Forecasting Model, version 4.0.
-
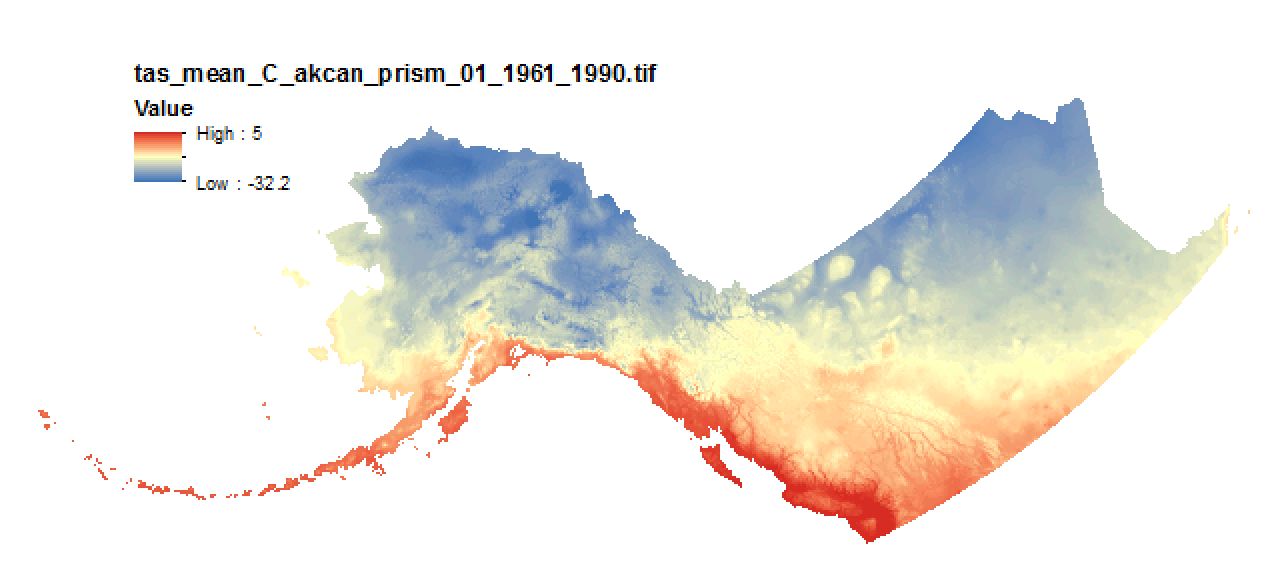
This dataset includes PRISM derived 1961-1990 climatologies of monthly average, maximum, and minimum temperature and total precipitation across Alaska and Western Canada including the Yukon, British Columbia, Alberta, Saskatchewan, and Manitoba. These were obtained from the PRISM Climate Group and mosaicked into a single continuous transboundary extent. Please cite the PRISM Climate Group when using this data.
-
This dataset consists of four different sub-datasets: degree days below 65°F (or "heating degree days"), degree days below 0°F, degree days below 32°F (or "freezing index"), and degree days above 32°F (or "thawing index"). All were derived from the same dataset of outputs from dynamically downscaling one reanalysis (ERA-Interim) and two CMIP5 GCMs (GFDL-CM3, NCAR-CCSM4) over Alaska using the Weather Research and Forecasting model (WRF). Data from the GCMs are driven exclusively by the RCP 8.5 emissions scenario. Heating degree days, degree days below 0°F, and freezing index were computed in the following way: subtract the daily mean temperature values from the threshold value and compute the sum of this time series for the given calendar year. Thawing index is instead computed as the annual sum of the quantities resulting from subtracting the threshold (32°F) from the daily mean temperature values.
-
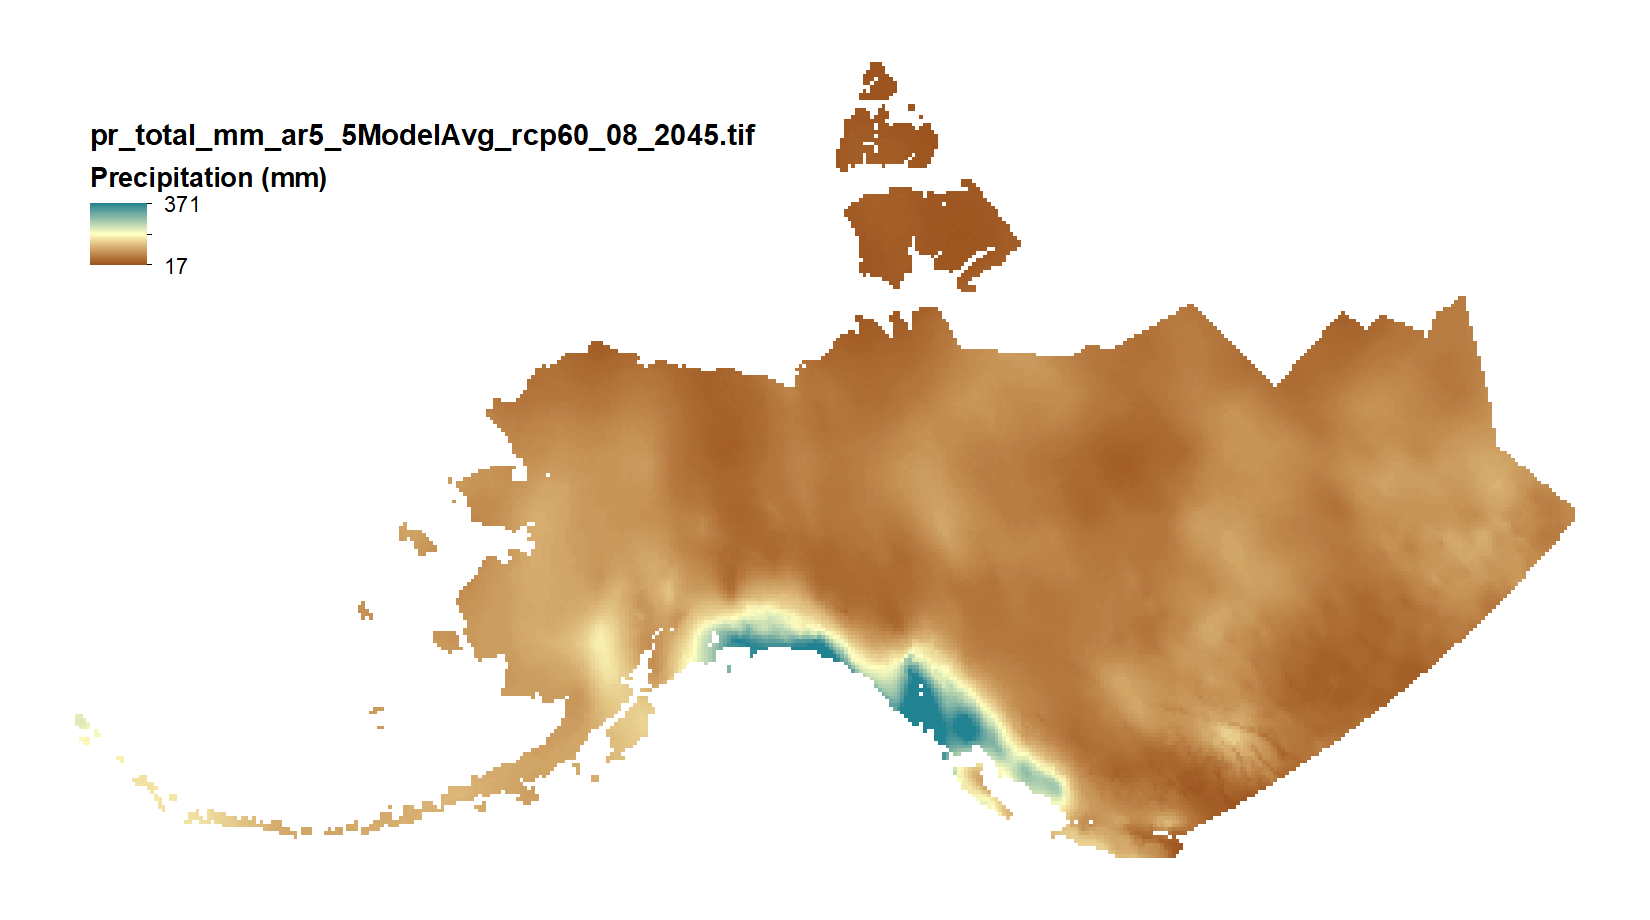
This set of files includes downscaled projections of monthly totals, and derived annual, seasonal, and decadal means of monthly total precipitation (in millimeters, no unit conversion necessary) from Jan 2006 - Dec 2100 at 771x771 meter spatial resolution. Each set of files originates from one of five top ranked global circulation models from the CMIP5/AR5 models and RPCs, or is calculated as a 5 Model Average. The downscaling process utilizes PRISM climatological datasets from 1971-2000. Brief descriptions of the datasets: Monthly precipitation totals: The total precipitation, in mm, for the month. For Decadal outputs: 1. Decadal Average Total Monthly Precipitation: 10 year average of total monthly precipitation. Example: All January precipitation files for a decade are added together and divided by ten. 2. Decadal Average Seasonal Precipitation Totals: 10 year average of seasonal precipitation totals. Example: MAM seasonal totals for every year in a decade are added together and divided by ten. 3. Decadal Average Annual Precipitation Totals: 10 year average of annual cumulative precipitation. For seasonal means, the four seasons are referred to by the first letter of 3 months making up that season: * `JJA`: summer (June, July, August) * `SON`: fall (September, October, November) * `DJF`: winter (December, January, February) * `MAM`: spring (March, April, May) Please note that these maps represent climatic estimates only. While we have based our work on scientifically accepted data and methods, uncertainty is always present. Uncertainty in model outputs tends to increase for more distant climatic estimates from present day for both historical summaries and future projections.
-
This dataset consists of sea ice indicators for the Arctic based on daily sea ice concentrations derived from satellite passive microwave measurements. The four indicators available are day of break-up start, day of break-up end, day of freeze-up start, and day of freeze-up end. These “day of year” values indicate the ordinal day of the ice-year on which the event occurred. The ice-year is defined as September 1 through August of the following year. Locally defined indicators can serve as key links between pan-Arctic or global indicators such as sea-ice extent or volume and local uses of sea ice, with the potential to inform community-scale adaptation and response.
-
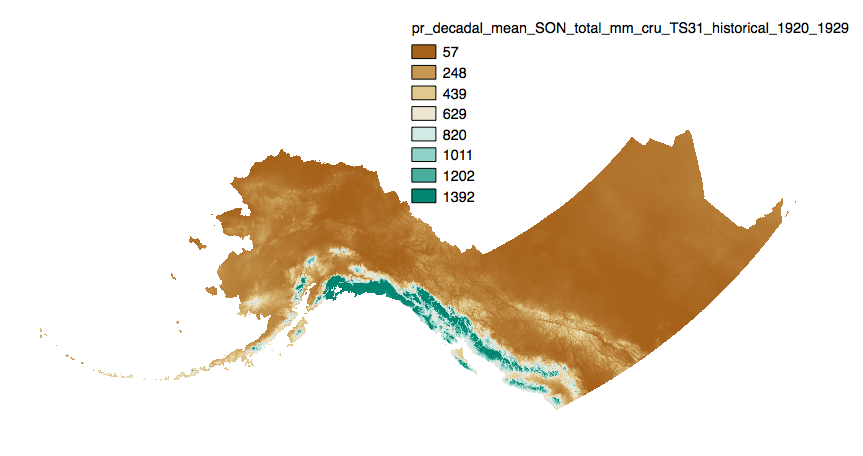
This dataset includes downscaled historical estimates of monthly average, minimum, and maximum precipitation and derived annual, seasonal, and decadal means of monthly total precipitation (in millimeters, no unit conversion necessary) from 1901 to 2006 (CRU TS 3.0), 2009 (CRU TS 3.1), 2015 (CRU TS 4.0), 2020 (CRU TS 4.05), or 2023 (CRU TS 4.08) at 2km x 2km spatial resolution. CRU TS 4.0 is only available as monthly averages, minimum, and maximum files. CRU TS 4.05 and 4.08 data are only available as monthly averages. The downscaling process utilizes PRISM climatological datasets from 1961-1990.
-
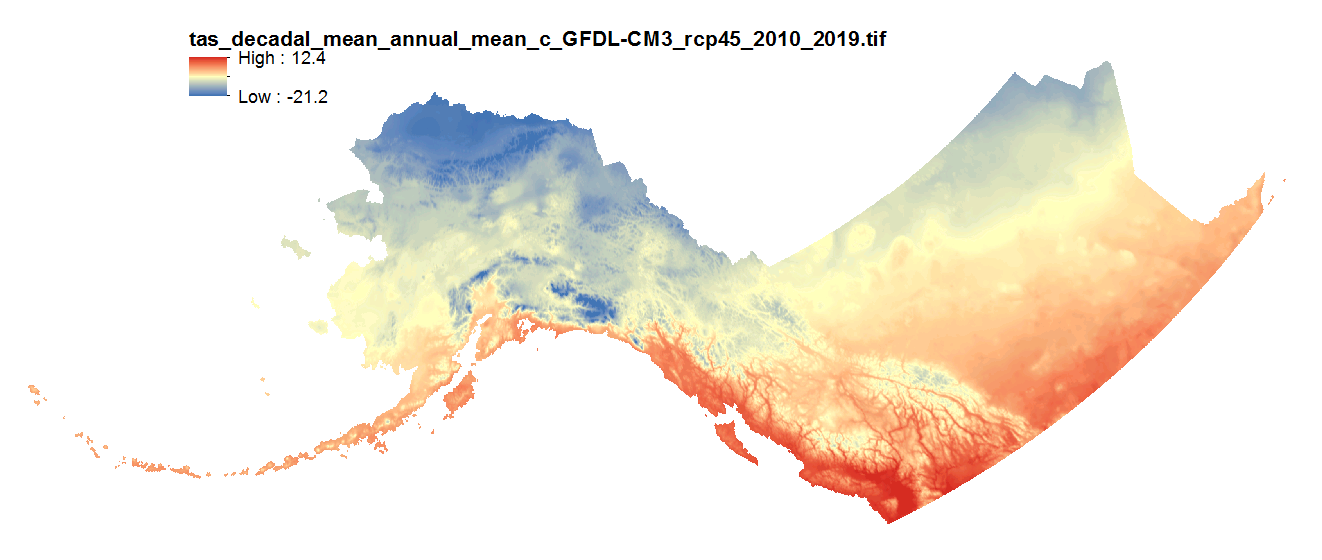
This set of files includes downscaled projections of monthly average, minimum, and maximum temperature and derived annual, seasonal, and decadal means of monthly average temperature (in degrees Celsius, no unit conversion necessary) from Jan 2006 - Dec 2100 at 2km x 2km spatial resolution across Alaska and parts of Canada. For seasonal means, the four seasons are referred to by the first letter of 3 months making up that season: * `JJA`: summer (June, July, August) * `SON`: fall (September, October, November) * `DJF`: winter (December, January, February) * `MAM`: spring (March, April, May) Each set of files originates from one of five top ranked global circulation models from the CMIP5/AR5 models and RPCs, or is calculated as a 5 Model Average. The downscaling process utilizes PRISM climatological datasets from 1961-1990. Please note that these maps represent climatic estimates only. While we have based our work on scientifically accepted data and methods, uncertainty is always present. Uncertainty in model outputs tends to increase for more distant climatic estimates from present day for both historical summaries and future projections.