 SNAP GeoNetwork
Climatology, meteorology, atmosphere
Type of resources
Topics
Keywords
Contact for the resource
Provided by
Years
Formats
Representation types
Update frequencies
status
Scale
Resolution
-
This dataset includes PRISM derived 1961-1990 climatologies of monthly average, maximum, and minimum temperature and total precipitation across Alaska and Western Canada including the Yukon, British Columbia, Alberta, Saskatchewan, and Manitoba. These were obtained from the PRISM Climate Group and mosaicked into a single continuous transboundary extent. Please cite the PRISM Climate Group when using this data.
-
This dataset consists of four different sub-datasets: degree days below 65°F (or "heating degree days"), degree days below 0°F, degree days below 32°F (or "freezing index"), and degree days above 32°F (or "thawing index"). All were derived from the same dataset of outputs from dynamically downscaling one reanalysis (ERA-Interim) and two CMIP5 GCMs (GFDL-CM3, NCAR-CCSM4) over Alaska using the Weather Research and Forecasting model (WRF). Data from the GCMs are driven exclusively by the RCP 8.5 emissions scenario. Heating degree days, degree days below 0°F, and freezing index were computed in the following way: subtract the daily mean temperature values from the threshold value and compute the sum of this time series for the given calendar year. Thawing index is instead computed as the annual sum of the quantities resulting from subtracting the threshold (32°F) from the daily mean temperature values.
-
This data set consists of PRSIM precipitation climatologies for Alaska in GeoTIFF format. The files in this data set are available from the PRISM Climate Group as text files but have been processed into GeoTIFFs. These are monthly climatologies with a resolution of 771m. Units are millimeters. There are multiple climatological periods currently available through PRISM, but only one is currently available through SNAP in this dataset: 1971-2000.
-
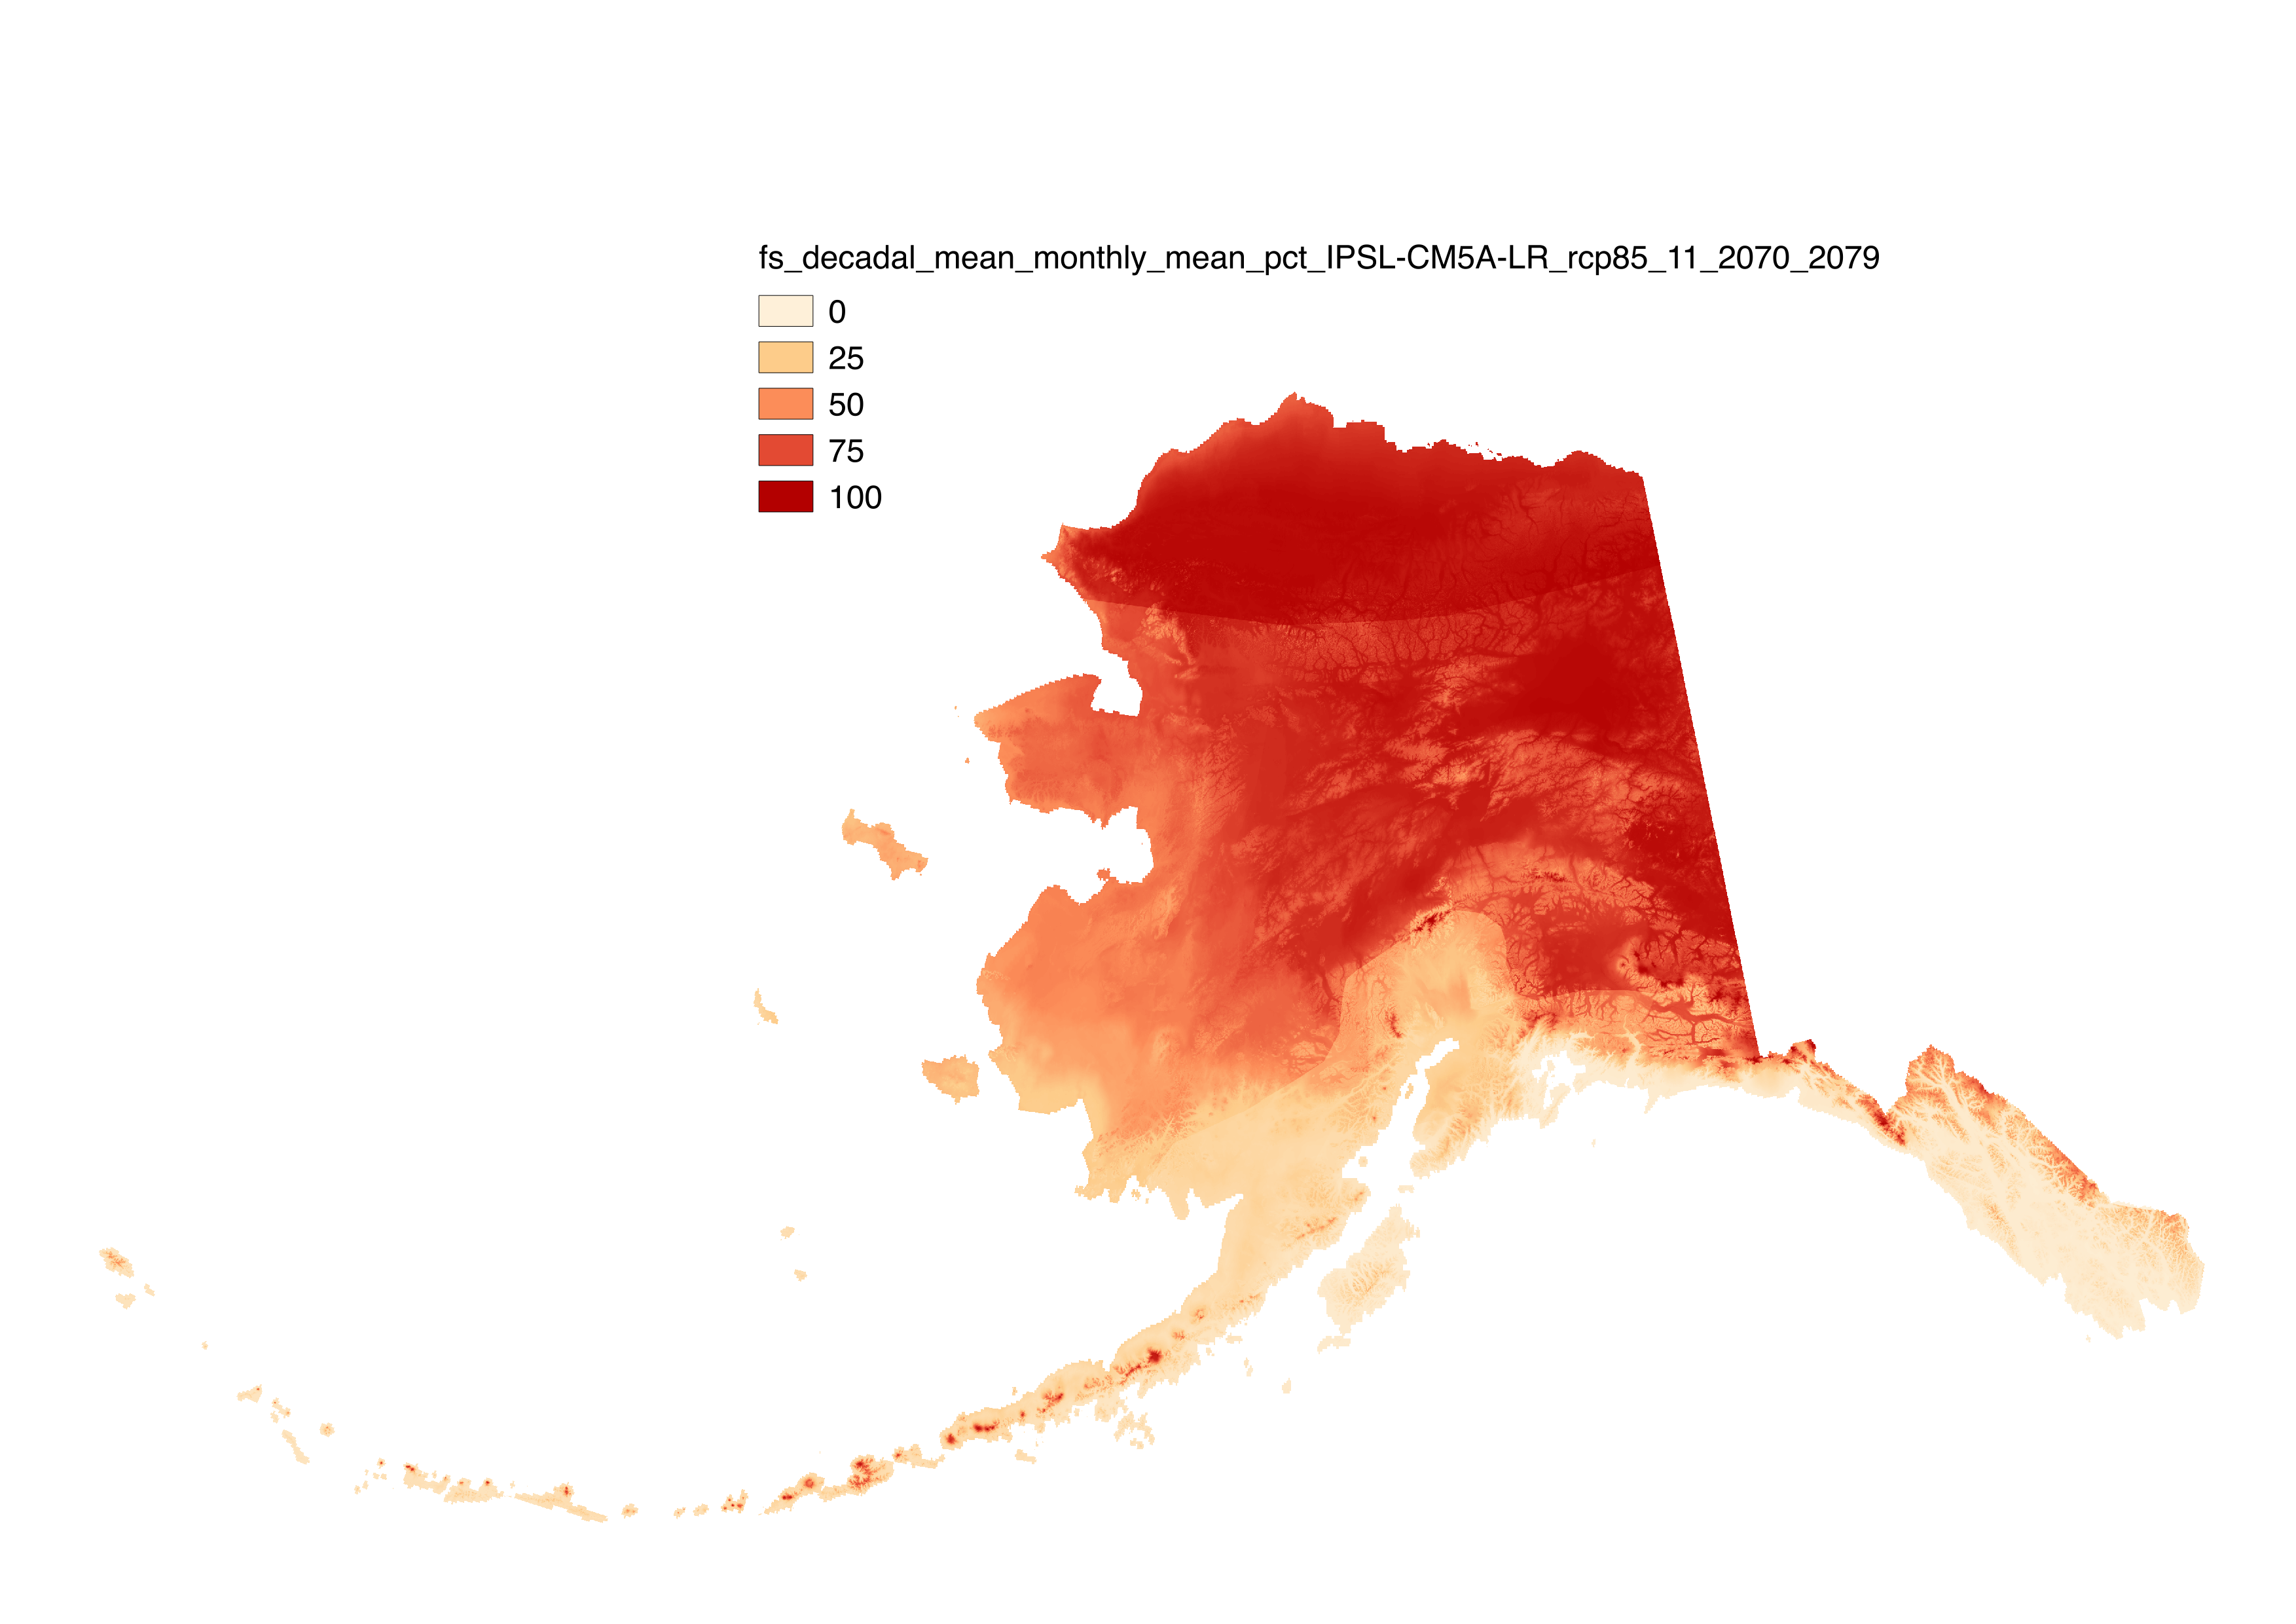
These files include downscaled projections of decadal average monthly snow-day fraction ("fs", units = percent probability from 1 – 100) for each month of the decades from 2010-2019 to 2090-2099 at 771 x 771 m spatial resolution. Each file represents a decadal average monthly mean. Output is available for the CCSM4, GFDL-CM3, GISS-E2-R, IPSL-CM5A-LR, and MRI-CGCM3 models and three emissions scenarios (RCP 4.5, RCP 6.0 and RCP 8.5). These snow-day fraction estimates were produced by applying equations relating decadal average monthly temperature to snow-day fraction to downscaled decadal average monthly temperature. Separate equations were used to model the relationship between decadal monthly average temperature and the fraction of wet days with snow for seven geographic regions in the state: Arctic, Western Alaska, Interior, Cook Inlet, SW Islands, SW Interior, and the Gulf of Alaska coast, using regionally specific logistic models of the probability that precipitation falls as snow given temperature based on station data fits as in McAfee et al. 2014. These projections differ from McAfee et al. 2014 in that updated CMIP5 projected temperatures rather than CMIP3 temperatures were used for the future projections. Although the equations developed here provide a reasonable fit to the data, model evaluation demonstrated that some stations are consistently less well described by regional models than others. It is unclear why this occurs, but it is likely related to localized climate conditions. Very few weather stations with long records are located above 500m elevation in Alaska, so the equations used here were developed primarily from low-elevation weather stations. It is not clear whether the equations will be completely appropriate in the mountains. Finally, these equations summarize a long-term monthly relationship between temperature and precipitation type that is the result of short-term weather variability. In using these equations to make projections of future snow, as assume that these relationships remain stable over time, and we do not know how accurate that assumption is. These snow-day fraction estimates were produced by applying equations relating decadal average monthly temperature to snow-day fraction to downscaled projected decadal average monthly temperature. The equations were developed from daily observed climate data in the Global Historical Climatology Network. These data were acquired from the National Climatic Data Center in early 2012. Equations were developed for the seven climate regions described in Perica et al. (2012). Geospatial data describing those regions was provided by Sveta Stuefer. Perica, S., D. Kane, S. Dietz, K. Maitaria, D. Martin, S. Pavlovic, I. Roy, S. Stuefer, A. Tidwell, C. Trypaluk, D. Unruh, M. Yekta, E. Betts, G. Bonnin, S. Heim, L. Hiner, E. Lilly, J. Narayanan, F.Yan, T. Zhao. 2012. NOAA Atlas 14. Precipitation-Frequency Atlas of the United States.
-
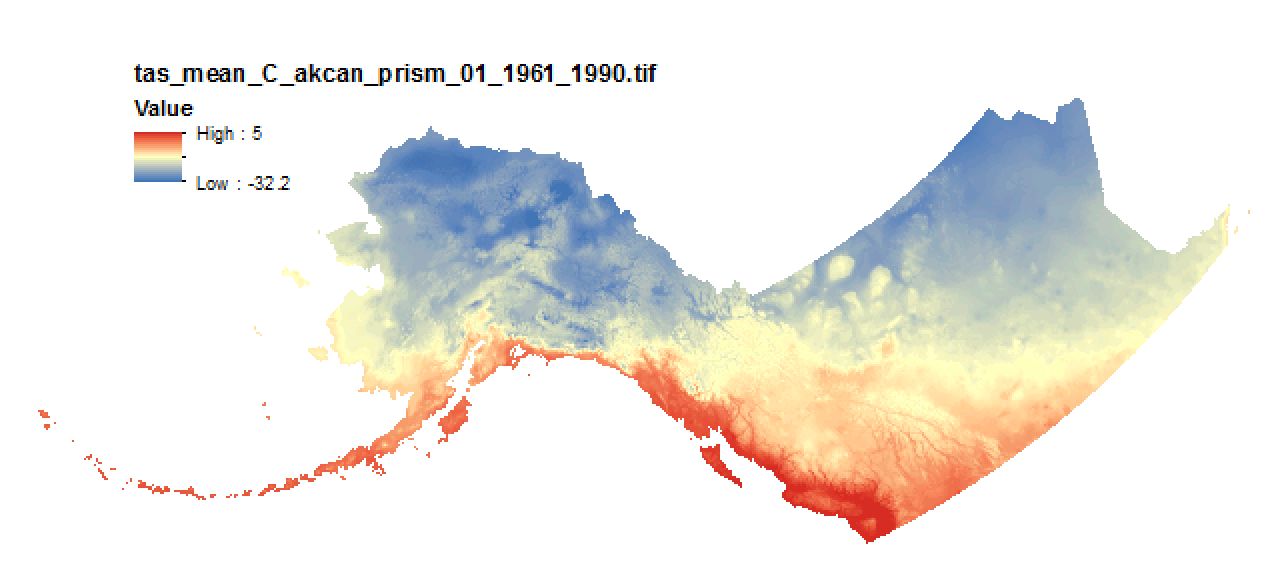
This data set consists of PRSIM mean air temperature climatologies for Alaska in GeoTIFF format. The files in this data set are available from the PRISM Climate Group as text files but have been processed into GeoTIFFs. These are monthly climatologies with a resolution of 771m. Units are degrees Celsius. There are multiple climatological periods currently available through PRISM, but only one is currently available through SNAP in this dataset: 1971-2000.
-
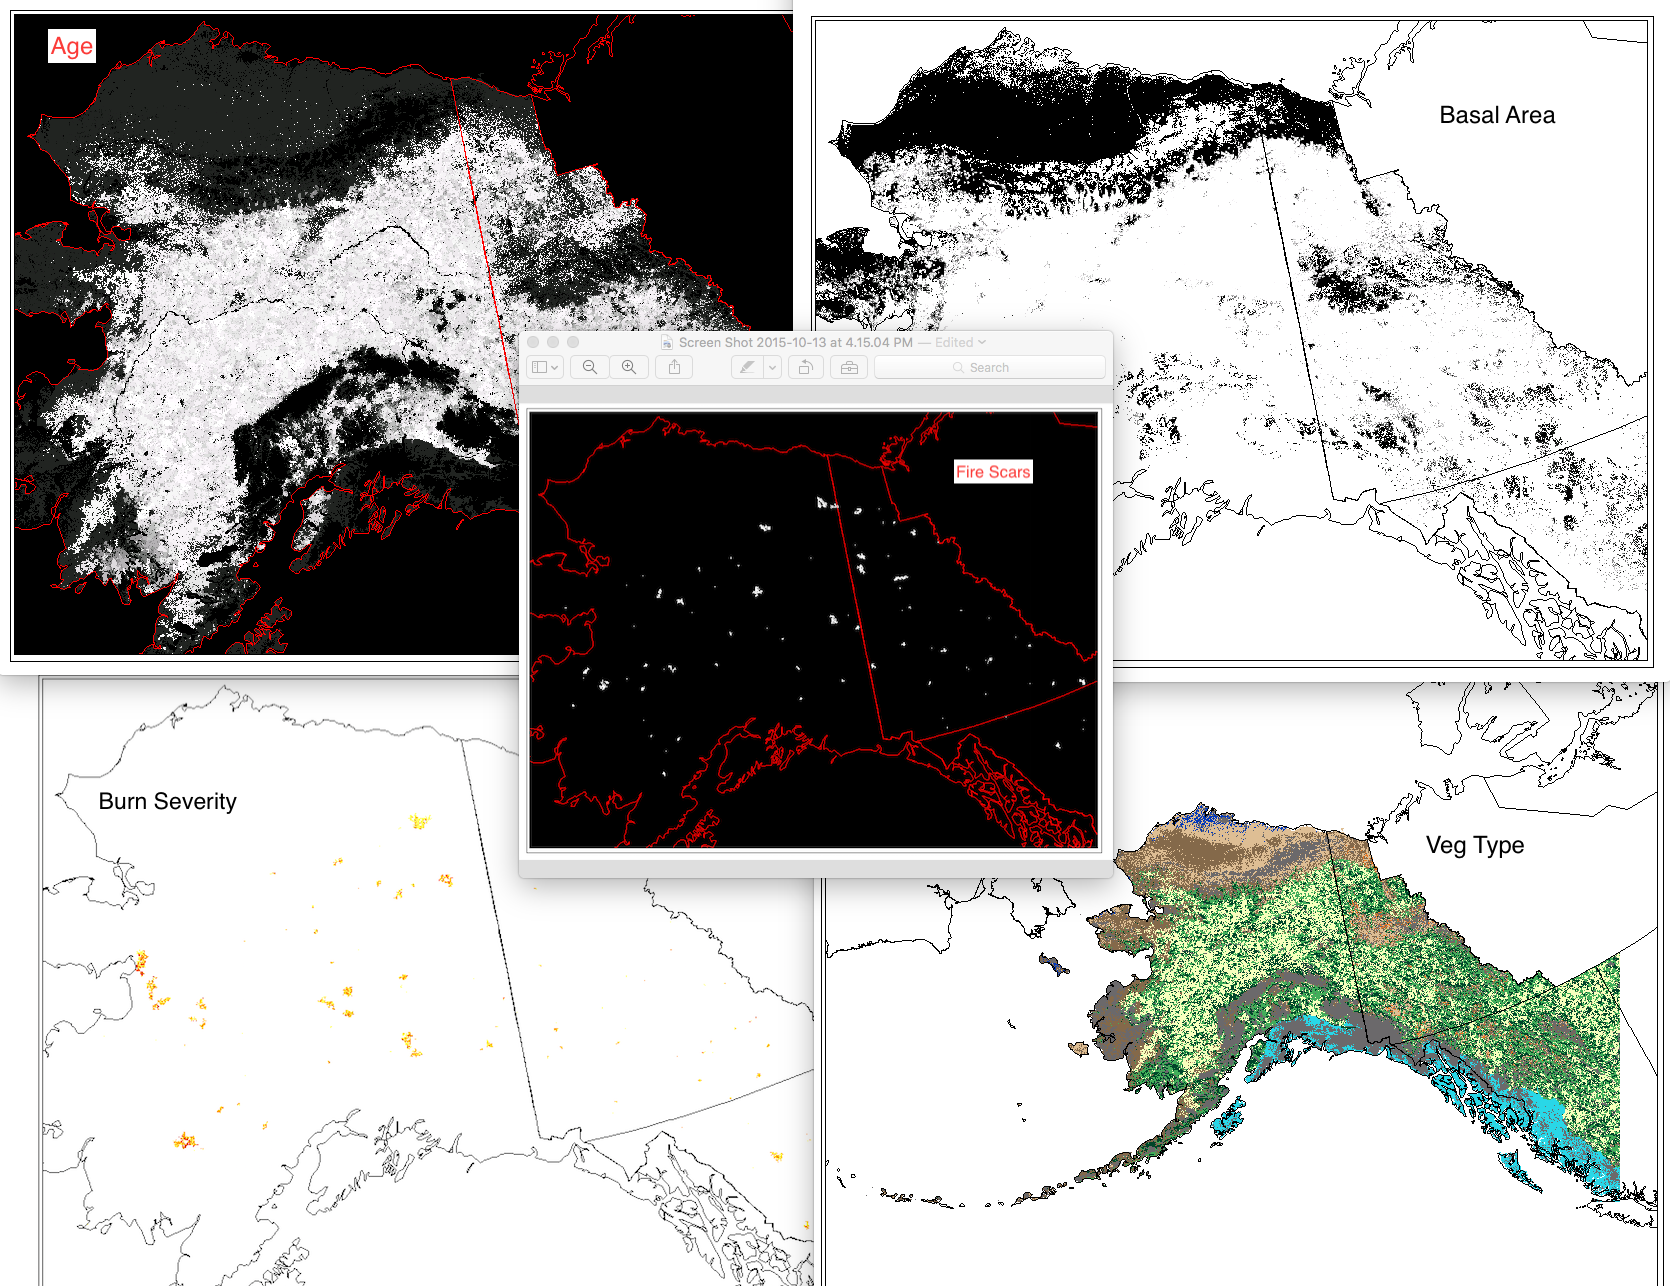
This set of files includes annual model outputs from ALFRESCO, a landscape scale fire and vegetation dynamics model. These specific outputs are from the Integrated Ecosystem Model (IEM) project, and are from the linear coupled version using AR4/CMIP3 climate inputs (IEM Generation 1-AR4) and AR5/CMIP5 climate inputs (IEM Generation 1-AR5). These outputs include data from model rep 171(IEM Generation 1-AR4) and rep 26 (IEM Generation 1-AR5), referred to as the “best rep” out of 200 replicates. The best rep was chosen through comparing ALFRESCO’s historical fire outputs to observed historical fire patterns. Single rep analysis is not recommended as a best practice, but can be used to visualize possible changes. Climate models and emission scenarios: IEM Generation 1-AR4/CMIP3 CCCMA-CGCMS-3.1 MPI-ECHAM5 under the SRES A1B scenario IEM Generation 1-AR5/CMIP5 MRI-CGCM3 NCAR-CCSM4 under RCP 8.5 scenario Variables include: Veg: The dominant vegetation for this cell. Current values are: 0 = Not Modeled 1 = Black Spruce 2 = White Spruce 3 = Deciduous Forest 4 = Shrub Tundra 5 = Graminoid Tundra 6 = Wetland Tundra 7 = Barren / Lichen / Moss 8 = Temperate Rainforest Age: This the age of the vegetation in each cell. An Age value of 0 means it transitioned in the previous year. Basal Area: The accumulation of basal area of white spruce in tundra cell, and is influenced by seed dispersal, growth of biomass, climate data, and other factors. units = m^2 / ha Burn Severity: This is a categorical burn severity level of the previous burn in the current cell, influenced by fire size and slope. For example, a burn severity value in a file with year 1971 in the file name means that the severity level given to that file occurred in the fire that occurred in year 1970. 0=No Burn 1=Low 2=Moderate 3=High w Low Surface Severity 4=High w/ High Surface Severity Fire Scar: These are the unique fire scars. Each cell has three values. Band 1 - Year of burn Band 2 - Unique ID for the simulated fire for that simulation year Band 3 - Whether or not the cell was an ignition location for a fire. There will only be 1 ignition cell per fire per year. 0 = not ignition 1 = ignition point For background on ALFRESCO, please refer to: Is Alaska's Boreal Forest Now Crossing a Major Ecological Threshold? Daniel H. Mann, T. Scott Rupp, Mark A. Olson, and Paul A. Duffy Arctic, Antarctic, and Alpine Research 2012 44 (3), 319-331 http://www.bioone.org/doi/abs/10.1657/1938-4246-44.3.319
-

This set of files includes downscaled historical estimates of monthly total precipitation (in millimeters) at 1 kilometer spatial resolution. Each file represents a single month in a given year. The original SNAP downscaled precipitation product at 2 kilometer spatial resolution was resampled to 1 kilometer spatial resolution via bilinear interpolation to create these data for input to the Integrated Ecosystem Model (IEM). Please note that this data is used to fill in a gap in available data for the IEM and does not constitute a complete or precise measurement of this variable in all locations.
-

These files include downscaled historical decadal average monthly snowfall equivalent ("SWE", in millimeters) for each month at 771 x 771 m spatial resolution. Each file represents a decadal average monthly mean. Historical data for 1910-1919 to 1990-1999 are available for CRU TS3.0-based data and for 1910-1919 to 2000-2009 for CRU TS3.1-based data.
-

This set of files includes annual model outputs from ALFRESCO, a landscape scale fire and vegetation dynamics model. These specific outputs are from the Integrated Ecosystem Model (IEM) project, and are from the linear coupled version using AR4/CMIP3 climate inputs (IEM Generation 1-AR4) and AR5/CMIP5 climate inputs (IEM Generation 1-AR5). These outputs include data from model rep 171 (IEM Generation 1-AR4) and rep 26 (IEM Generation 1-AR5), referred to as the “best rep” out of 200 replicates. The best rep was chosen through comparing ALFRESCO’s historical fire outputs to observed historical fire patterns. Single rep analysis is not recommended as a best practice, but can be used to visualize possible changes. Please note that this data is used to fill in a gap in available data for the Integrated Ecosystem Model (IEM) and does not constitute a complete or precise measurement of this variable in all locations. **Climate models and emission scenarios:** IEM Generation 1-AR4/CMIP3 CCCMA-CGCMS-3.1 MPI-ECHAM5 under the SRES A1B scenario IEM Generation 1-AR5/CMIP5 MRI-CGCM3 NCAR-CCSM4 under RCP 8.5 scenario Variables include: -------------- **Veg**: The dominant vegetation for this cell. Current values are: 0 = Not Modeled 1 = Black Spruce 2 = White Spruce 3 = Deciduous Forest 4 = Shrub Tundra 5 = Graminoid Tundra 6 = Wetland Tundra 7 = Barren / Lichen / Moss 8 = Temperate Rainforest **Age**: This the age of the vegetation in each cell. An Age value of 0 means it transitioned in the previous year. **Basal Area**: The accumulation of basal area of white spruce in tundra cell, and is influenced by seed dispersal, growth of biomass, climate data, and other factors. units = m^2 / ha **Burn Severity**: This is a categorical burn severity level of the previous burn in the current cell, influenced by fire size and slope. For example, a burn severity value in a file with year 1971 in the file name means that the severity level given to that file occurred in the fire that occurred in year 1970. 0=No Burn 1=Low 2=Moderate 3=High w Low Surface Severity 4=High w/ High Surface Severity **Fire Scar**: These are the unique fire scars. Each cell has three values. Band 1 - Year of burn Band 2 - Unique ID for the simulated fire for that simulation year Band 3 - Whether or not the cell was an ignition location for a fire. There will only be 1 ignition cell per fire per year. 0 = not ignition 1 = ignition point For background on ALFRESCO, please refer to: Is Alaska's Boreal Forest Now Crossing a Major Ecological Threshold? Daniel H. Mann, T. Scott Rupp, Mark A. Olson, and Paul A. Duffy Arctic, Antarctic, and Alpine Research 2012 44 (3), 319-331 [http://www.bioone.org/doi/abs/10.1657/1938-4246-44.3.319](http://www.bioone.org/doi/abs/10.1657/1938-4246-44.3.319)
-
This dataset is the product of a climate-driven model of beetle survival and reproduction in Alaska. We used that model to create this dataset of landscape-level “risk” of the climatic component of beetle infestation across the forested areas of Alaska. This risk component can best be applied as protection of the landscape offered by the climate and is categorized as high, medium, and low. It does not consider other major factors, such as existing beetle and predator populations or forest susceptibility. We computed these values over one historical period (1988-2017) using the NCAR Daymet model, and three future periods (2010-2039, 2040-2069, 2070-2099) using four statistically downscaled global climate model projections, each run under two plausible greenhouse gas futures (RCP 4.5 and 8.5).